Managing Irrigation with Saline Water
ID
BSE-348P
 EXPERT REVIEWED
Introduction
Many irrigation sources in coastal areas have the potential to exhibit high salinity levels from time to time. On occasion, salinity levels can become high enough to cause noticeable damage to irrigated crops. Crop damage can occur from prolonged exposure to saline water or from a single event if salinity levels are high enough. However, crops differ significantly in their tolerance to saline irrigation water. Understanding the sensitivity of different crops can help irrigators avoid causing salinity damage while still ensuring that crops get enough water.
This Virginia Cooperative Extension bulletin aims to provide information about salinity’s impacts on different crops and strategies to manage salinity in irrigation water. More information on the factors that influence salinity in tidal rivers and streams is presented in VCE publication BSE-349NP, “Understanding Salinity in Tidal Waters – Information for Irrigators” (Larsson et al. 2023). For more information on potential salinity issues in groundwater wells, readers can refer to VCE publication BSE-215P, “Using Groundwater for Agricultural Irrigation in Virginia” (https://www.pubs.ext.vt.edu/BSE/BSE-215P/BSE-215P.html) (Shortridge 2017).
Understanding Salinity
Salinity refers to dissolved ions (molecules that carry an electric charge) in water or soils. Fresh water has few dissolved ions; saline water contains more dissolved ions. To understand salinity damage in plants, it’s important to know how water moves inside a plant. Transpiration is the process in which water is absorbed by the plant roots and discharged through openings (stomata) in the plant’s leaves. Water movement inside plants is a passive process, so it is largely driven by ion concentrations sometimes referred to as osmotic pressure. If there are too many ions dissolved in the soil water — that is, if the water is too saline — plants are unable to uptake water through their roots. In extreme conditions, water will actually move from the plant to the soil. Additionally, high ion levels can be toxic to the plant itself. Typical ions found in irrigation water include sodium (Na+), calcium (Ca2+), magnesium (Mg2+), sulfate (SO24-), and carbonate (HCO3-) (Yasuor, Yermiyahu, and Ben-Gal 2020).
The amount of salinity in water is typically expressed as either mass per unit volume or in terms of the electric conductivity of the water. Total dissolved solids (TDS) is a measurement of the mass of dissolved solids in the water, including salts, that can pass through a two-micron filter. TDS is reported in units of milligrams per liter (mg/L) or parts per million (ppm). Because dissolved salt is a good conductor of electricity, salinity levels can also be estimated by measuring the amount of electricity that a water sample can conduct across a unit length. Units for measuring salinity in irrigation water using electrical conductivity are decisiemens per meter (dS/m) or millisiemens per centimeter (mS/cm) (Fipps 2003).
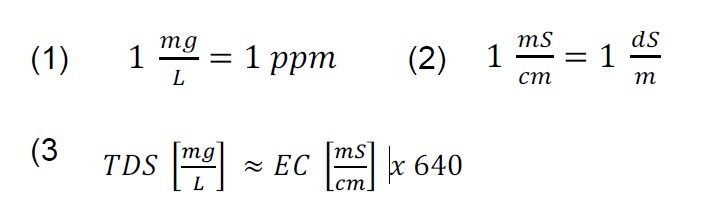
When comparing salinity data to crop thresholds, it may be necessary to convert salinity measurements between different units. To convert salinity readings between different units, the below equations can be used. The units of mg/L and ppm units are roughly equivalent and can be directly compared to each other (equation 1). The units of dS/m and mS/cm are also equivalent to each other, and are the primary units discussed in this bulletin (equation 2). Salinity measurements in mS/cm can be roughly converted to ppm by multiplying the mS/cm reading by 640 (equation 3). This is an approximate conversion because the exact relationship depends on the specific ions present.
Irrigation Salinity Limits for Crops
Different plants have different responses to salinity exposure over time, and some are more sensitive to salinity than others. Plants can adapt to excessive salinity levels by using several mechanisms. For example, some plants may delay germination or maturity until more
favorable conditions prevail, while others may exclude the salts at the root zone or compartmentalize it (Yadav et al. 2011). Agricultural crops are usually grouped into four categories based on their ability to survive under higher salinity: sensitive, moderately sensitive,
moderately tolerant, and tolerant (table 1). These categories are relative and should be used as a general guide. Fruit crops generally have the highest sensitivity to saline irrigation water, followed by vegetables and row crops.
| Sensitive | Moderately Sensitive | Moderately Tolerant | Tolerant |
|---|---|---|---|
| Bean Sesame |
Broadbean Castor bean Maize Flax Peanut Rice (Paddy) Sunflower Corn (field) |
Cowpea Soybean Sorghum Safflower Rye Oats Triticale Wheat |
Barley Cotton Canola Wheat (semi-dwarf) |
| Sensitive | Moderately Sensitive | Moderately Tolerant | Tolerant |
|---|---|---|---|
| Bean Carrot Okra Onion Parsnip |
Brassicas Celery Corn, sweet Cucumber, muskmelon, watermelon Eggplant Lettuce Pepper Potato Pumpkin Spinach Squash, scallop Sweet potato Tomato Garlic |
Artichoke Beet, red Squash, zucchini Lima bean |
Asparagus |
| Sensitive | Moderately Sensitive | Moderately Tolerant | Tolerant |
|---|---|---|---|
| Apple Apricot Berries Cherry, sweet, sand Currant Pear Persimmon Plum Strawberry |
Grape Melons |
Fig Pomegranate |
- |
Table 2 presents quantitative values for crop salinity tolerance. The most commonly referenced crop salinity tolerance values come from the document “Water Quality for Agriculture” that was produced by the United Nations Food and Agriculture Organization, or FAO (Ayers and Westcot 1985). This is a frequently cited publication appearing in several irrigation salinity guides. Many irrigation guides discuss two salinity measures: soil salinity, abbreviated ECe, and irrigation salinity, abbreviated ECw. ECw is the salinity of the irrigation water itself while ECe is the salinity of the soil. If a crop is not listed, salinity limits for a similar crop can serve as a guide. The salinity limits shown in table 2 are shown as a percent of anticipated yield, with 100% yield meaning there is no salinity damage from the irrigation water and 50% meaning that half the usual yield can be expected due to higher salinity levels. The Maximum Salinity levels shown in Table 2 are the highest recommended salinity level for irrigation water as recommended by the FAO.
| Crop | 100% | 90% | 75% | 50% | Maximum Tolerable Salinity Level (mS/cm) |
|---|---|---|---|---|---|
| Barley | 5.3 | 6.7 | 9.7 | 12.0 | 19.0 |
| Broadbean | 1.1 | 1.8 | 2.0 | 4.5 | 8.0 |
| Cotton | 5.1 | 6.4 | 8.4 | 12.0 | 18.0 |
| Cowpea | 3.3 | 3.8 | 4.7 | 6.0 | 8.8 |
| Maize | 1.1 | 1.7 | 2.5 | 3.9 | 6.7 |
| Peanut | 2.1 | 2.4 | 2.7 | 3.3 | 4.4 |
| Sorghum | 4.5 | 5.0 | 5.6 | 6.7 | 8.7 |
| Soybean | 3.3 | 3.7 | 4.2 | 5.0 | 7.0 |
| Wheat | 4.0 | 4.9 | 6.3 | 8.7 | 13.0 |
| Crop | 100% | 90% | 75% | 50% | Maximum Tolerable Salinity Level (mS/cm) |
|---|---|---|---|---|---|
| Bean | 0.7 | 1.0 | 1.5 | 2.4 | 4.2 |
| Beet, red | 2.7 | 3.4 | 4.5 | 6.4 | 10.0 |
| Broccoli | 1.9 | 2.8-2.6 | 3.7 | 5.5 | 9.1 |
| Cabbage | 1.2 | 1.9 | 2.9 | 4.6 | 8.1 |
| Carrot | 0.7-1.0 | 1.1 | 1.9 | 3.0 | 5.4 |
| Celery | 1.2 | 2.3 | 3.9 | 6.6 | 12.0 |
| Corn, sweet | 1.1 | 1.7 | 2.5 | 3.9 | 6.7 |
| Cucumber | 1.7 | 2.2 | 2.9 | 4.2 | 6.8 |
| Eggplant | 1.1 | - | - | - | - |
| Lettuce | 0.9 | 1.4 | 2.1 | 3.4 | 6.0 |
| Onion | 0.8 | 1.2 | 1.8 | 2.9 | 5.0 |
| Pepper | 1.0-1.5 | 1.5 | 2.2 | 3.4 | 5.8 |
| Potato | 1.1-1.6 | 1.7 | 2.5 | 3.9 | 6.7 |
| Radish | 0.8 | 1.3 | 2.1 | 3.4 | 5.9 |
| Spinach | 1.3 | 2.2 | 3.5 | 5.7 | 10.0 |
| Squash, scallop | 2.1 | 2.6 | 3.2 | 4.2 | 6.3 |
| Squash, zucchini | 3.1 | 3.8 | 4.9 | 6.7 | 10.0 |
| Sweet potato | 1.0 | 1.6 | 2.5 | 4.0 | 7.1 |
| Tomato | 1.7-2.5 | 2.3 | 3.4 | 5.0 | 8.4 |
| Turnip | 0.6 | 1.3 | 2.5 | 4.3 | 8.0 |
| Crop | 100% | 90% | 75% | 50% | Maximum Tolerable Salinity Level (mS/cm) |
|---|---|---|---|---|---|
| Apricot | 1.1 | 1.3 | 1.8 | 2.5 | 3.8 |
| Blackberry | 1.0 | 1.3 | 1.8 | 2.5 | 4.0 |
| Grape | 1.0 | 1.7 | 2.7 | 4.5 | 7.9 |
| Plum | 1.0 | 1.4 | 1.9 | 2.9 | 4.7 |
| Strawberry | 0.7 | 0.9 | 1.2 | 1.7 | 2.7 |
Recognizing Salinity Damage
Salt stress can occur in different ways depending on crop species and length of exposure. Salt accumulation near the root system from irrigation water or excessive fertilization usually produces necrosis (burn-like tissue) in the new leaves, initiating from the tips and then extending around the edge towards the leaf base. If the effect of the excessive salinity is prolonged, this damage will slowly transition to the old leaves and may result in structural damage to the plant. Exposure to high salt conditions will decrease plant photosynthetic activity and therefore reduce crop yield, as many biochemical processes are inhibited during the time of exposure. In general, biomass reduction and foliar damage become more prominent with time and at higher salinity levels (Shahid et al. 2020). Saline conditions can negatively impact fruit quality in terms of fruit pulp thickness and firmness, although in some cases and within limits it will increase fructose and glucose fruit concentration (Rubio et al. 2009).
In legume crops, high salt concentrations can result in small-sized nodules, reduced nodule volume per plant, and poor plant growth. Salinity also causes a reduction in the nitrogen-fixing ability of the nodules, which results in reduced respiration rate and protein synthesis (Shahid et al. 2020). High salt accumulation has been reported to reduce water tissue content in cucumbers, leading to a reduction in photosynthesis (Stepien and Klobus 2006). Similarly, plants under salt stress will have reduced stomatal conductance and transpiration (Shahid et al. 2020). Stomatal conductance is often correlated with photosynthetic efficiency, which is a prerequisite for higher biomass production and yield (Ashraf and Harris 2013). Higher salt levels are also known to alter photosynthesis via non-stomatal limitations, including variations in photosynthetic enzyme activity and changes in the concentration of chlorophyll and carotenoids. Given the large array of detrimental effects that can occur, it is paramount for farmers to be aware of adequate management strategies to protect plants from excessive salinity.
Managing Irrigation with Saline Water
It is important to understand that crops generally are not only exposed to excessive salts from soil or irrigation water, but rather to a combination of the naturally occurring ions in the soil and water in addition to the fertilizer amendments applied throughout the growing season.
In situations where irrigation water sources could be high in salinity, such as what might occur in tidal rivers, shallow groundwater wells, and farm ponds in coastal locations, growers can use both short-term and long-term strategies to meet crop water demands while avoiding salinity damage. The first step is to understand salinity levels in water sources and how these levels might change over time. Salinity levels can be measured using handheld meters or by sending a water sample to a lab. Labs will generally provide more accurate measurements than handheld meters but have a downside in that they only provide a snapshot of the time when the sample was collected. There will also be a time delay between sample collection and the time when results are provided by the lab, and salinity concentrations could change during this time. Because of this, they are a better choice for water sources where salinity levels are expected to be relatively constant, such as a groundwater well that does not experience large changes in water level through the season. For surface water sources, multiple samples will likely be needed to capture periods of high and low salinity, and so the convenience of using handheld meters would offset the lower level of accuracy that might occur. Additional information on salinity levels in coastal rivers and streams is provided in Virginia Cooperative Extension Publication BSE-349NP, “Understanding Salinity in Tidal Waters – Information for Irrigators” (Larsson et al. 2023).
In situations where salt stress is possible, coordinated irrigation and fertilizer management can help mitigate the damaging effects of salinity. Having adequate management practices for water and fertilizer will help decrease the likelihood of overirrigation, which can lead to excessive accumulation of salts in the soil after the runoff and deep-percolation processes are over. Likewise, it could also prevent under-irrigation, which can lead to dehydrated plants and overheated tissue, resulting in damaged cells, excessive respiration, and reduced photosynthesis and biomass production (virtually the same symptoms as excessive salinity). There are many ways to correctly manage irrigation in agricultural systems; these are discussed in VCE publications BSE- 239P, “Irrigation Scheduling in Humid Climates Using the Checkbook Method” (https://www.pubs.ext.vt.edu/content/pubs_ext_vt_edu/en/BSE/BSE-239/BSE-239. html) (Shortridge 2018); BSE-338P, “Soil Moisture Sensors for Agricultural Irrigation: An Overview on Sensor Types and Data Retrieval Methods” (https://ext.vt.edu/content/pubs_ext_vt_edu/en/BSE/BSE-338/ BSE-338.html) (Shortridge and Porter 2021a); and BSE- 339P, “Scheduling Agricultural Irrigation Based on Soil Moisture Content: Interpreting and Using Sensor Data” (https://www.pubs.ext.vt.edu/content/pubs_ext_vt_edu/en/BSE/BSE-339/BSE-339.html) (Shortridge and Porter 2021b).
Similarly, fertilization management is key to reducing the potentially damaging effects of high salinity in irrigation water. Excessive fertilizer rates, inadequate frequencies of application and placement, and bad source selections can lead to increasing the salt concentrations in the soil or growing media near the roots system, which will only be exacerbated by the salinity content of the irrigation water. Farmers should be familiar with the 4R nutrient stewardship as a framework to achieve their cropping system goals. The 4Rs stand for “right source,” “right rate,” “right place,” and “right time.” This framework focuses on using fertilizers intentionally and avoiding over-fertilization. For more information about 4R nutrient stewardship, see “What is 4R Nutrient Stewardship,” a publication from the Institute of Food and Agricultural Sciences at the University of Florida (https://edis.ifas.ufl.edu/publication/HS1264) (Liu et al. 2022).
While many water sources will experience short-term changes in salinity due to weather or tides, other issues can create longer-lasting salinity problems as well. For instance, in coastal groundwater wells with a declining water level, salinity can increase gradually due to saltwater intrusion. Upstream surface water withdrawals that permanently decrease discharge levels could create long-term increases in salinity levels. Sea level rise can make both of these problems worse. In water sources where salinity levels are expected to stay high, growers may need to consider augmenting their irrigation supplies with another freshwater source to avoid salinity problems. They may also need to consider growing more salt-tolerant crops. Treating water to remove salts is technologically challenging and generally too expensive to be profitable in agricultural settings. More detailed information regarding irrigation strategies can be found in the Texas A&M bulletin “Irrigation Management with Saline Water” (cotton.tamu.edu/Irrigation/ IrrigationwithSalineWater.pdf) (Porter and Marek 2006), which includes links to further resources.
Summary
While irrigation can provide great benefits in terms of crop health and yield, the use of saline water for irrigation can lead to risks as well. To manage these risks, it is crucial that growers be aware of salinity levels in their irrigation water sources as well as the relative sensitivity of their crops. In general, fruit crops tend to be most sensitive to salinity, followed by vegetables. Row crops tend to be least sensitive, although specific salinity thresholds can vary significantly across each of these groups. In many natural water bodies, salinity levels will vary depending on weather, upstream activities, and tides. In situations where crops are irrigated with potentially saline water, regular monitoring of source water salinity can help growers avoid applying irrigation during periods of high salinity. If more permanent increases in salinity are occurring in an irrigation water source, growers may need to consider alternate cropping strategies to avoid damage and maintain sufficient production. Well-coordinated irrigation and fertilizer management can also help reduce the impacts of salinity damage and should be an element of any irrigated cropping system.
Acknowledgements
We acknowledge the following peer reviewers, whose thoughtful comments greatly improved this document: Michael Broaddus, unit coordinator and Caroline County Extension agent, Virginia Cooperative Extension; Teresa Pittman, Accomack County Extension agent, Virginia Cooperative Extension; Dr. Mark Reiter, professor of Soils and Nutrient Management, Virginia Tech; and Dr. Lincoln Zotarelli, associate professor of Horticultural Sciences, University of Florida.
References
Ashraf, M., and P. J. C. Harris. 2013. “Photosynthesis Under Stressful Environments: An Overview.” Pho- tosynthetica 51: 163–190. https://doi.org/10.1007/s11099-013-0021-6.
Ayers, R. S. and Westcot, D. W. 1985. Water Quality for Agriculture: FAO Irrigation and Drainage Paper 29 Rev. 1. Food and Agriculture Organization of the United Nations. https://www.fao.org/3/t0234e/T0234E00.htm.
Farooq, M., N. Gogoi, M. Hussain, S. Barthakur, S. Paul, N. Bharadwaj, H. M. Migdadi, S. S. Alghamdi, K. H. M. Siddique. 2017. “Effects, Tolerance Mechanisms, and Management of Salt Stress in Grain Legumes.” Plant Physiology and Biochemistry 118: 199-217.
Fipps, G. 2003. Irrigation Water Quality Standards and Salinity Management. Publication B-1667. Texas A&M AgriLife Extension, College Station, Texas. https://lubbock.tamu.edu/programs/disciplines/irri-gation-water/salinity-and-irrigation-water-quality/.
Larsson, N., S. Romelczyk, R. Longest, and J. Shortridge. 2023. Understanding Salinity in Tidal Waters–Information for Irrigators. VCE Publication BSE- 349NP. Virginia Cooperative Extension, Blacksburg.
Liu, G., K. Morgan, Y. Li, L. Zotarelli, Q. Wang, and J. DeValerio. 2022. “What is 4R Nutrient Stewardship?” Institute of Food and Agricultural Sciences, University of Florida, Gainesville. https://edis.ifas.ufl.edu/publication/HS1264.
Porter, D. O. and T. Marek. 2006. Irrigation Management with Saline Water: Proceedings of the 2006 Central Plains Irrigation Conference and Exposition. Colby, Kansas. February 21-22, 2006. http://cotton.tamu.edu/Irrigation/IrrigationwithSalineWater.pdf.
Rubio, J. S., F. Garcia-Sanchez, F. Rubio, and V. Mar- tinez. 2009. “Yield, Blossom-end Rot Incidence and Fruit Quality in Pepper Plants Under Moderate Salinity are Affected by K+ and Ca+2 Fertilization.” Scientia Horticulturae 119: 79–87.
Shahbaz, M., M. Ashraf, F. Al-Qurainy, and P. J. C. Harris. 2012. “Salt Tolerance in Selected Vegetable Crops.” Critical Reviews in Plant Sciences 31: 303- 320.
Shahid, M. A., A. Sarkhosh, N. Khan, R. M. Balal, S. Ali, L. Rossi, C. Gomez, N. Mattson, W. Nasim, and F. Garcia-Sanchez. 2020. “Insights into the Physiolog- ical and Biochemical Impacts of Salt Stress on Plant Growth and Development.” Agronomy 10 no. 7: 938. https://doi.org/10.3390/agronomy10070938.
Shortridge, J. 2017. Using Groundwater for Agricultural Irrigation in Virginia. VCE Publication BSE-215P. Virginia Cooperative Extension, Blacksburg. https://www.pubs.ext.vt.edu/BSE/BSE-215P/BSE-215P. html.
Shortridge, J. 2018. Irrigation Scheduling in Humid Climates Using the Checkbook Method. VCE Pub- lication BSE-239P. Virginia Cooperative Extension, Blacksburg. https://www.pubs.ext.vt.edu/BSE/BSE-239/BSE-239.html.
Shortridge, J. and W. Porter. 2021a. Soil Moisture Sensors for Agricultural Irrigation: An Overview on Sensor Types and Data Retrieval Methods. VCE Publication BSE-338. Virginia Cooperative Extension, Blacksburg. https://www.pubs.ext.vt.edu/content/pubs_ext_vt_edu/en/BSE/BSE-338/BSE-338.html.
Shortridge, J. and W. Porter. 2021b. Scheduling Agricultural Irrigation Based on Soil Moisture Content: Interpreting and Using Sensor Data. VCE Publication BSE-339P. Virginia Cooperative Extension, Blacksburg. https://www.pubs.ext.vt.edu/content/ pubs_ext_vt_edu/en/BSE/BSE-339/BSE-339.html.
Stepien, P. and G. Klobus. 2006. “Water Relations and Photosynthesis in Cucumus sativus L. Leaves Under Salt Stress.” Biologia Plantarum 50: 610–616.
Yadav, S., M. Irfan, A. Ahmad, and S. Hayat. 2011. “Causes of Salinity and Plant Manifestations to Salt Stress: A Review.” Journal of Environmental Biology, 32(5): 667-685. https://www.researchgate.net/ publication/221818713_Causes_of_salinity_and_plant_manifestations_to_salt_stress_A_review.
Yasuor, H., U. Yermiyahu, and A. Ben-Gal. 2020. “Consequences of Irrigation and Fertigation of Vegetable Crops with Variable Quality Water: Israel as a Case Study.” Agricultural Water Management, 242: 106362.
Virginia Cooperative Extension materials are available for public use, reprint, or citation without further permission, provided the use includes credit to the author and to Virginia Cooperative Extension, Virginia Tech, and Virginia State University.
Virginia Cooperative Extension is a partnership of Virginia Tech, Virginia State University, the U.S. Department of Agriculture (USDA), and local governments, and is an equal opportunity employer. For the full non-discrimination statement, please visit ext.vt.edu/accessibility.
Publication Date
May 9, 2023