

Scheduling Agricultural Irrigation Based on Soil Moisture Content: Interpreting and Using Sensor Data
ID
BSE-339P
 EXPERT REVIEWED
Irrigation can be a crucial part of avoiding crop losses and improving yields. However, to obtain the best agronomic and financial results, irrigation should be scheduled in a way that prevents crop water stress while also avoiding overwatering. Irrigation scheduling is the practice of determining when to irrigate and how much water to apply. If too much time passes between irrigation events, plants can experience water stress, poor growth, and low yields. On the other hand, when too much irrigation is applied, water will run off fields or percolate down below the root zone. This leads to excessive pumping costs and the loss of nutrients applied to the field. It also has negative environmental impacts since excess water is used, and leached nutrients can harm surface and groundwater quality.
Soil moisture sensors can support irrigation scheduling by telling you how much water is present in your soil at any time. Irrigation should be applied when soil moisture levels drop below a minimum threshold. Enough water should be applied so that soil moisture levels increase across the root zone of the plant, but not so much that water runs off or drains below the root zone. Soil moisture sensors can help determine when, how much, and how quickly irrigation should be applied. However, this requires understanding and interpreting the data provided by soil moisture sensors.
The goal of this publication is to provide an overview on using soil moisture data to support irrigation scheduling. It complements other VCE publications. VCE publication BSE-239P, “Irrigation Scheduling in Humid Climates Using the Checkbook Method” (Shortridge 2018), describes how to schedule irrigation when soil moisture data are unavailable. VCE publication BSE- 338P, “Soil Moisture Sensors for Agricultural Irrigation: An Overview on Sensor Types and Data Retrieval Methods” (Shortridge and Porter 2021), provides an overview on different methods for soil moisture sensing, including manual inspection, various types of soil moisture sensors, and remote sensing. VCE publication BSE-198P, “Understanding Soil Moisture Sensors: A Fact Sheet for Irrigation Professionals in Virginia” (Sample et al. 2016), provides details on different types of soil moisture sensors and how they can be used in landscape irrigation.
This publication assumes that the reader is familiar with basic soil water concepts such as field capacity, permanent wilting point, and plant-available water. More information on these topics is presented in VCE publication BSE-239P (Shortridge 2018). The first section of this publication provides some discussion on optimal placement of soil moisture sensors within a field for irrigation scheduling. The second section presents irrigation thresholds for different soil types and crops that can be used to determine when irrigation is needed. And the third section discusses methods for determining the appropriate irrigation depth; in other words, how much irrigation should be applied. By reading this document, irrigators and educators should gain a better understanding of how soil moisture data can be used to improve irrigation scheduling in order to improve yields while avoiding unnecessary water use.
Sensor Placement
During sensor installation, it is important to consider the locations within a field and the depths in the soil profile that will provide the most useful information for irrigation management. In choosing locations, make sure that sensors are installed where they will not be damaged by passing personnel or equipment. Consider attaching orange flags to the sensors or data loggers to increase their visibility. Sensors should be placed in a location where soil conditions are representative of those in the field being irrigated. In fields with different soil textures or crops, sensors should ideally be located in each management zone to provide data that is relevant to each soil type and crop being grown. Consideration should be taken into account for the inherently poor uniformity of most center pivot irrigation systems. Center pivot irrigations commonly see variability of +/- 25% of the average application. Drip irrigation systems can have similar uniformity issues, particularly if the tape runs are too long for the diameter and flow rate or if header lines are undersized. Placing a sensor in an area with application rates significantly above or below average will drive the user to make incorrect irrigation management decisions. It is recommended that a minimum of three sensor stations per field be used to spread the risk of measuring in areas of poor uniformity and to clearly measure all soil types.
Sensor depth should be based on typical rooting depths for the crops being monitored (a summary of root depths for common crops is provided in table 1 of VCE publication BSE-239P [Shortridge 2018]). Installing sensors at multiple depths provides information across the full soil profile and can be useful in optimizing irrigation during different stages of the growing season. For instance, installing a shallow sensor 6 inches below ground is important for monitoring soil moisture conditions early in the growing season when roots are shallow. Shallow sensors can serve as an early warning for soil moisture becoming too low, as this sensor will dry out before deeper parts of the soil profile. Shallow sensors also aid in monitoring irrigation and rainfall events. On the other hand, a deep sensor toward the bottom part of the root zone (18-24 inches below ground) is important in ensuring that enough water is applied during irrigation events and in avoiding overirrigating by responding only to fluctuations in shallow soil moisture. In situations where soil texture changes with depth, sensors should be placed at depths so that each soil type encountered can be monitored.
Irrigation Thresholds
Using soil sensors for irrigation requires determining an irrigation threshold that is suitable for the soil, crop, and management choices for the field being irrigated. Irrigation thresholds are sometimes based on soil water tension values for different soil types (table 1). However, a limitation with this approach is that it bases irrigation decisions on the soil dryness alone rather than on the impact that soil dryness has on the crop. An alternative approach to irrigation scheduling is management allowable depletion (MAD), which is the portion of the plant-available water that can be depleted before plant stress begins to occur. This value is crop-specific; for instance, some sensitive vegetables (e.g., lettuce, potatoes, and peppers) have a MAD as low as 30%, while corn has a MAD of 50% This means that lettuce plants should be irrigated when approximately 30% of plant-available water has been depleted, while irrigation of corn can wait until 50% of plant-available water has been depleted.
| Soil condition | Loamy sand | Sandy loam | Loam | Silt loam | Clay loam |
|---|---|---|---|---|---|
| Field capacity | 10 | 15 | 20 | 20 | 25 |
| Typical irrigation threshold | 25-30 | 30-40 | 35-50 | 40-60 | 60-80 |
| Soil condition | Loamy sand | Sandy loam | Loam | Silt loam | Clay loam |
|---|---|---|---|---|---|
| Field capacity | 16 | 21 | 27 | 30 | 29 |
| Permanent wilting point | 7 | 9 | 12 | 15 | 18 |
| Plant-available water capacity | 9 | 12 | 15 | 15 | 11 |
Table 2 presents MAD values for different crops, as well as the soil water tension and volumetric water content values at which these depletion levels occur. These values should be taken as general guidelines because the optimal irrigation threshold will vary depending on crop type, soil conditions, and management practices. For instance, drought-resistant varieties should be resistant to higher levels of depletion than what is indicated in this table. Irrigation events on large fields with center pivot or hose-pull systems can sometimes require long irrigation periods (over 24 hours). In these instances, irrigation should be started at lower levels of depletion to avoid stress in the sections of the field that are irrigated last.
| Crop | MAD (%) | Soil water tension (kPa or cb) |
Loamy sand (%) |
Sandy loam (%) |
Loam (%) |
Silt loam (%) |
Clay loam (%) |
|---|---|---|---|---|---|---|---|
| Alfalfa | 50-60 | 80-150 | 12 | 15 | 20 | 23 | 24 |
| Cantaloupe /melons |
40-45 | 35-40 | 12 | 16 | 21 | 24 | 25 |
| Carrots | 35 | 55-65 | 13 | 17 | 22 | 25 | 25 |
| Corn | 50-55 | 50-80 | 12 | 15 | 20 | 23 | 24 |
| Cotton | 65 | 100-120 | 10 | 13 | 17 | 20 | 22 |
| Small grain (vegetative stage) |
50 | 40-50 | 12 | 15 | 20 | 23 | 24 |
| Small grain (ripening stage) |
55 | 70-80 | 11 | 14 | 19 | 22 | 23 |
| Lettuce | 30 | 40-60 | 13 | 17 | 23 | 26 | 26 |
| Onions | 30 | 45-65 | 13 | 17 | 23 | 26 | 26 |
| Peanuts | 50 | 40-60 | 12 | 15 | 20 | 23 | 24 |
| Peppers | 30 | 20-30 | 13 | 17 | 23 | 26 | 26 |
| Potatoes | 30-40 | 30-50 | 13 | 17 | 23 | 26 | 26 |
| Soybeans | 45 | 40-60 | 12 | 16 | 20 | 23 | 24 |
| Tomatoes | 40 | 60-150 | 12 | 16 | 21 | 24 | 25 |
Irrigation Depth
In humid climates like Virginia, irrigation depths should generally be less than what is required to fill the soil back up to field capacity. If the soil is irrigated to field capacity, there is no room to store any additional water from rainfall that occurs after irrigating, and this water will be lost to deep percolation or runoff. This can lead to unnecessary pumping costs and nutrient loss. On the other hand, if too little water is applied, only the upper portions of the soil profile will be replenished. This can lead to poor root development early in the growing season and require frequent irrigation events. Some irrigation systems are well- suited to applying regular, small amounts of irrigation, but this can be inconvenient or even infeasible for other types of systems. For example, many drip irrigation systems are designed for frequent irrigation events, but sprinkler irrigation systems designed to irrigate large fields will typically require longer times between irrigation, thus requiring less frequent but larger applications of water.
Another important thing to consider in determining irrigation depth is the infiltration capacity of the soil. While the soil water holding capacity is the amount of water that the soil can hold, the infiltration rate is the speed at which the soil can absorb this water. In coarse soils (sands), infiltration rates can be as high as 0.4 to 0.8 inch per hour, even reaching rates above 1.0 inch per hour in long-term no-till fields. In finer grained soils (clays and clay loams), infiltration rates are slower (sometimes under 0.2 inch per hour for clay soils). This means that if more than 0.2 inch of water is applied over an hour, some of the water will pond at the surface and potentially run off. In general, if you observe water ponding at the surface during irrigation events, it means that the irrigation rate is greater than the infiltration capacity of the soil, and the irrigation rate needs to be reduced.
If soil moisture sensors are installed at different depths, you can identify when enough water has been applied by monitoring how the deepest sensor in the soil profile responds to irrigation (fig. 1). If soil moisture levels in the deepest sensor do not increase at all, this indicates that only the shallow soil has been wetted, and more irrigation should be applied. However, if too much irrigation is applied, the lower sensor will reach field capacity and some water will drain below the root zone.
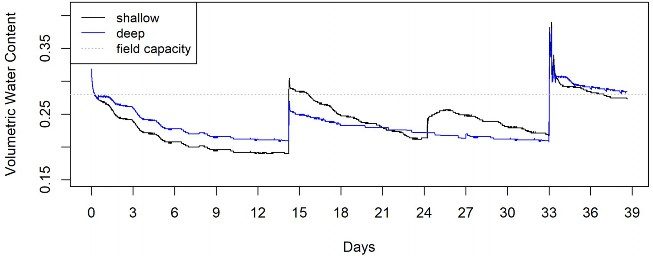
Figure 1 shows a time series of soil moisture levels in two sensors located in the same location but different depths to demonstrate this concept. On the first day, irrigation is applied that brings the soil moisture level at both depths up to field capacity. Soil moisture levels decline until day 14, when irrigation is applied. Soil moisture levels increase in both sensors, but the deep
sensor does not exceed the field capacity, indicating that an appropriate amount of irrigation was applied. The field receives water again on day 24, but the depth of water is too low, and it only increases soil moisture in the shallow soil with no impact on the deep sensor. On day 33, excess water is applied, causing both the shallow and deep sensors to exceed field capacity, meaning that some of this water will drain below the root zone.
If soil moisture readings are only available at one depth, the irrigation depth can be determined based on the maximum plant-available water in the soil. The maximum plant-available water is the difference between the field capacity and permanent wilting point values in table 1, multiplied by the plants’ rooting depth. For instance, in a sandy loam with a rooting depth of 24 inches, the maximum plant-available water is
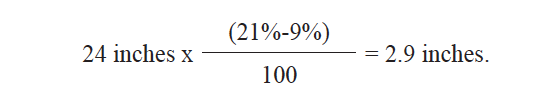
At the MAD level of 0.45, there are 1.6 inches of water available in the soil:
2.9 x (1.00-0.45)=1.6 inches.
To irrigate back to field capacity, we would apply 2.9 – 1.6 = 1.3 inches of water to the field. However, irrigating to a minor water balance deficit of 10-20% will avoid plant water stress while still leaving room in the soil profile for rainfall that might occur in the coming days. In this example, a water balance deficit of 10% would mean that the target irrigation application would result in there being 2.6 inches of water in the soil profile:
2.9 x (1.0-0.1) = 2.6 inches.
So applying 1 inch of irrigation, rather than 1.3 inches of irrigation will raise the water balance of the soil from 1.6 inches to 2.6 inches, leaving 0.3 inch of soil water capacity should rainfall occur.
When irrigating, it is always important to consider the irrigation efficiency of your system. For example, sprinkler irrigation efficiency is typically 60-90%, meaning that 10-40% of irrigation water is lost to evaporation, wind drift, etc., and will not get into the soil profile. It is also important to consider the infiltration capacity of the soil as application rates above 0.6 inch per hour often have significant infield movement of irrigation to areas of low elevation. Even in coarse soils, applying over 1 inch of water will likely require multiple irrigation events to avoid runoff, and this is even more likely to be the case in heavier soils with lower infiltration rates. More details and examples of how to calculate maximum plant-available water and irrigation depths are provided in VCE publication BSE- 239P (Shortridge 2018).
Conclusions
Properly scheduling irrigation is an important step in making sure that plants have sufficient water while also avoiding the excess costs, nutrient losses, and environmental impacts associated with overwatering. Monitoring soil moisture conditions can inform irrigation scheduling by helping producers know when to irrigate and how much water to apply. Many different sensing methods are available to aid in irrigation scheduling. To benefit from these sensors, irrigators must know how to interpret and use the data to determine when and how much irrigation to apply. By connecting the dots between sensor measurements and irrigation management, growers can improve yields without excess costs or environmental harm.
References
Barlow, S., J. S. Fields, D. J., J. S. Owen, and D. J. Sample. 2016. Understanding Soil Moisture Sensors: A Fact Sheet for Irrigation Professionals in Virginia. VCE publication BSE-198P. https:// resources.ext.vt.edu/contentdetail?contentid=3039.
Datta, S., S. Taghvaeian, and J. Stivers. 2017. Understanding Soil Water Content and Thresholds for Irrigation Management. Oklahoma Cooperative Extension Service fact sheet BAE-1537. Stillwater: Oklahoma Cooperative Extension.
Leib, B., T. Grant, A. McClure, and A. Shekoofa. 2019. The Basics of Soybean Irrigation in Tennessee. University of Tennessee Extension publication W 809-B. https://extension.tennessee.edu/publications/ Documents/W809-B.pdf.
Maughan, T., D. Drost, and L. Niel Allen. 2015. Vegetable Irrigation: Sweet Pepper and Tomato. Utah State University Extension. Horticulture/ Vegetable 2015-03. Logan: USU Extension.
https://digitalcommons.usu.edu/cgi/viewcontent. cgi?article=1738&context=extension_curall.
Nuñez, J., D. R. Haviland, B. J. Aegerter, R. A. Baldwin, B. B. Westerdahl, J. T. Trumble, and R. G. Wilson. 2019. UC IPM Pest Management Guidelines: Potato. UC ANR publication 3463. Oakland: University of California Integrated Pest Management. www2.ipm.ucanr.edu/agriculture/ potato/Irrigation/.
Shortridge, J. 2018. Irrigation Scheduling in Humid Climates Using the Checkbook Method. VCE publication BSE-239P. Blacksburg: VCE. https://www.pubs.ext.vt.edu/BSE/BSE-239/BSE-239.html.
Shortridge, J., and W. Porter. 2021. Soil Moisture Sensors for Agricultural Irrigation: An Overview on Sensor Types and Data Retrieval Methods. VCE publication BSE-338P. Blacksburg: VCE.
https://www.pubs.ext.vt.edu/content/pubs_ext_vt_edu/en/BSE/BSE-338/BSE-338.html.
Virginia Cooperative Extension materials are available for public use, reprint, or citation without further permission, provided the use includes credit to the author and to Virginia Cooperative Extension, Virginia Tech, and Virginia State University.
Virginia Cooperative Extension is a partnership of Virginia Tech, Virginia State University, the U.S. Department of Agriculture (USDA), and local governments, and is an equal opportunity employer. For the full non-discrimination statement, please visit ext.vt.edu/accessibility.
Publication Date
August 10, 2021
