Protective Agriculture Production Series: Plant density recommendations
ID
SPES-474NP
The importance of plant density
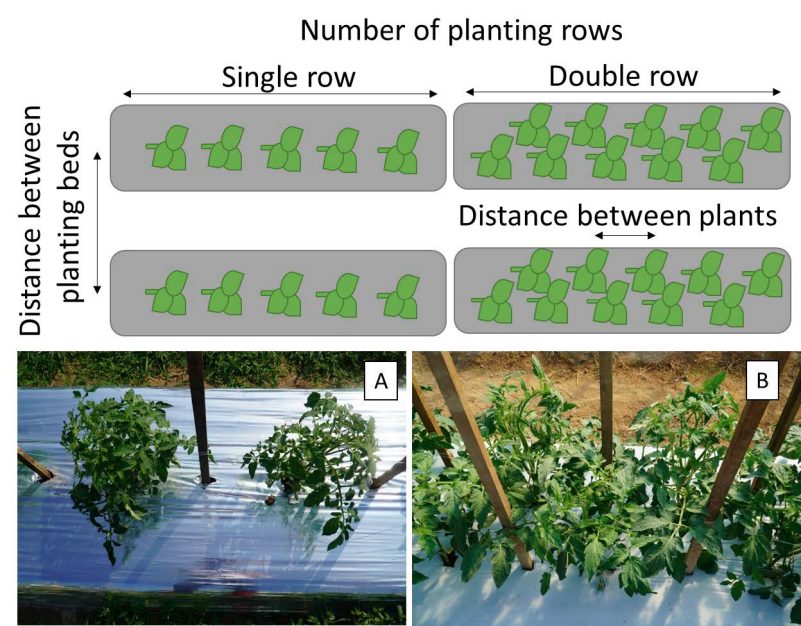
Plant density simply refers to the number of individuals (plants) per unit of area. This variable is usually calculated from the combination of three parameters: the length between planting beds, the distance between plants within each row, and the number of planting rows within each bed (Figure 1). Although plant density is a simple concept commonly used by farmers and agricultural professionals all over the world, its determination and correct selection have multiple ecological and economic implications, especially under protective structures.
The effects of plant density can be classified into three distinctive groups: above-ground and below- ground competition, and economic implications. First, planting density will affect light interception by plants and therefore photosynthetic activity and overall biomass production. There is a direct relationship between the interception of solar radiation and plant biomass production (Black, 1957; Francis and Decoteau, 1993; Wilson and Tilman, 1993). The less available light there is, the lower the plant growth potential. Furthermore, plant- to-plant shading promotes changes in light quality, triggering hormones that elongate the stem of the plants being shaded. This phenomenon is commonly referred to as etiolation.
Similarly, plants actively compete for multiple resources below ground, primarily water, and essential nutrients. Vegetables are often grown in planting beds, which provide a homogenized, non- compacted, and often treated area for the adequate development of the roots. However, these same beds, often restrict root expansion and force roots to develop within the bed perimeter. Under these conditions, plants will be partially restricted to water and nutrients within the planting bed, and if established under high-density conditions, the available resources might not be enough for the correct development of the plants. Planting density is often taken into consideration when fertilization and water management recommendations are provided for most open-field vegetables. However, the implementation of alternative production systems, such as high tunnels and greenhouses, forces farmers to assign heavier consideration to the economic viability of their system and its potential profitability per unit of area. Protected structures improve crop fruit quality and yield, while protecting the plants from rain, wind, and freeze events. However, these structures require relatively high initial investments compared to open-field production, making profits highly dependent on yield per unit area (Torres-Quezada et al., 2021).
It is impossible to individually target the effect of a production practice within an agricultural system, and planting density selection is no exception. Most of the current in-row spacing recommendations for vegetables under protected culture are based on open-field studies. However, under high tunnels and greenhouses, the plastic roof often changes the growing environment to which plants are subjected. Modern plastic films are made of multiple polyethylene layers with special additives designed to alter light transmittance to the interior of structures (Giacomelli and Robert, 1993; Wyzgolik et al., 2008). Additionally, the trellising system and pruning practices will alter the plant architecture, and therefore the spatial distribution of the foliage. Lastly, water and nutrient management under high tunnels and greenhouses tend to be very specialized, often relying on multiple daily applications of fertilizers at low concentrations. Hence, the growing system and structure, water and nutrient management program, and selected cultivar will influence plant development, light interception, resource availability, and consequently planting density recommendations.
Basic plant density units
Depending on the selected reference, planting densities can be expressed in different units. The most common unit of plant density for literature generated in the U.S. is plants per acre. However, given that many countries have large production areas dedicated to protective structures, and devoted extensive efforts to the generation of recommendations for their systems. It is common for farmers and extension agents to cite recommendations based on the International Unit System, which is widely used in South America and Europe. In these cases, plants per hectare is the most common unit of plant density referenced.
Additionally, given the importance of enhancing profitability per unit area under protective structures, in many cases planting density recommendations are expressed in plants per square meter. Although the conversion between plants per acre and plants per hectare is straightforward (plants per acre = plants per hectare/2.47≈2.5), the practical implementation of any density recommendation requires detailed information about the distance between plants, beds, and the number of planting rows.
For example, a recommendation of 6,534 plants per acre is usually achieved from the combination of 20 inches of in-row spacing in a single row and 48 inches (4 ft) between planting beds. However, this same recommendation can be achieved with 16 inches of in-row distance in a single row with 60 inches (5-ft) between planting beds.
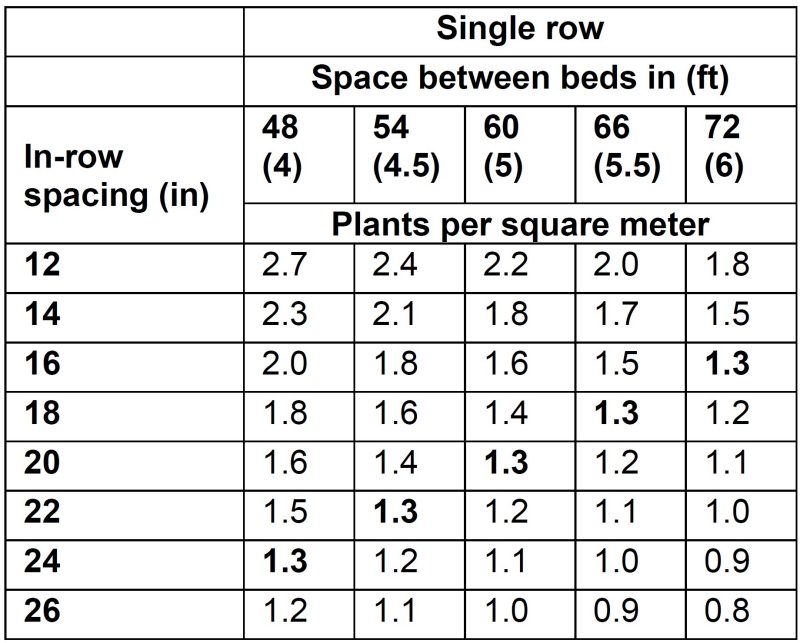
Correspondingly, a recommendation of 1.3 plants per square meter can be interpreted as multiple spatial arrangements (Table 1). This situation can create ambiguity among recommendations, and researchers should always clarify their recommendations so farmers can easily implement them.
Table 1. Permutations of between-bed spacing and in-row spacing in terms of plants per square meter.
Growing habits and planting density interactions in protective structures
Planting density recommendations vary drastically among crop species with most references for in-row spacing ranging between 1.5 inches (onion) to 72 inches (large pumpkins). Similarly, planting rows (rows per bed) and space between beds range from a single row to multiple rows per bed, and 16 to 144 inches between beds, respectively. However, even within the same crop species, there can be discrepancies in planting recommendations, usually related to differences in production systems, season length, and cultivar selection. A common reference point that aids to define the most adequate plant density recommendation under protective structures is the cropping species growing habit. Many plants can be classified as determinate or indeterminate when referencing their growth habit. A determinate plant will begin its vegetative development normally, but once the first set of flowers is produced, the plants will slow down the production of leaves, branches, and overall growth, to allocate energy to the production of fruits. This is the reason open-field crops (e.g., tomatoes and bell peppers) stop their vertical growth once flowers and fruits show up. Conversely, indeterminate plants will grow and produce fruits at the same time. This is the reason tomato and bell pepper plants are so big when grown under greenhouse conditions. It is not a direct effect of the greenhouse, but a genetic characteristic of the cultivar in combination with a series of production practices tailored to this specific system.
Indeterminate plants tend to produce higher biomass than determinate plants, given that they do not reduce their speed of growth once they reach their reproductive stage. Hence, it is plausible to think that a plant with more leaves and a longer stem will require higher solar radiation to develop and therefore will require a lower plant density to achieve this. However, the contrary is true. In many cases, plant density recommendations for greenhouses are higher than open-field recommendations. This is because, under a greenhouse or high tunnel, farmers usually influence plant architecture through pruning and trellising.
Additionally, farmers make an extra effort to tailor their fertilization and irrigation as much as possible to tend to the needs of their crops and maintained them through a longer season than an open-field system. This usually results in higher quality and yield of the plants, but it also comes with large resources and time expenditure. Table 2 shows the current vegetable plant density recommendations for open-field and protective structure production in accordance with the crop growth habit. Please use these recommendations as a reference but reach out to your extension agent if your production system deviates from the table description.
Why do we have a range of recommendations for planting densities?
Every time you see a recommendation in a production handbook or extension document, you must take into consideration the origin of those numbers. Recommendations are usually the results of research data averaged across different locations, systems, and years. Researchers evaluate different in-row spacings per crop and collect data on plant performance and yield, so they can recommend the density that allowed the plants to perform to higher standards. The issue arises when analyzing and presenting the data. There are two ways of evaluating plant density data: yield per plant or yield per area.
When analyzing plant density data on a yield per plant basis, is easy to see trend lines going from higher yield with lower density to lower yield with higher densities. This usually makes sense for most people as they relate high-density planting with higher competition among plants, and likely lower yields (Figure 2).
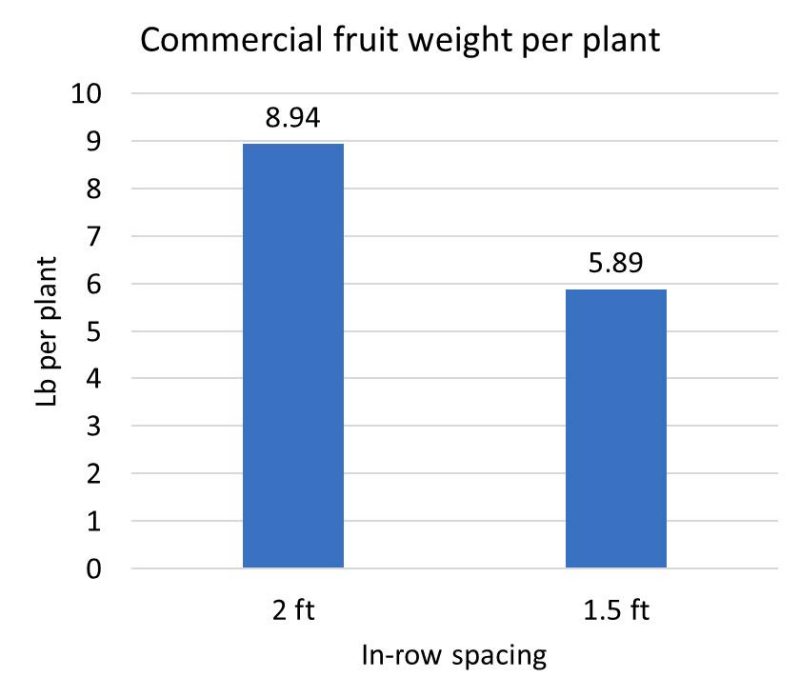
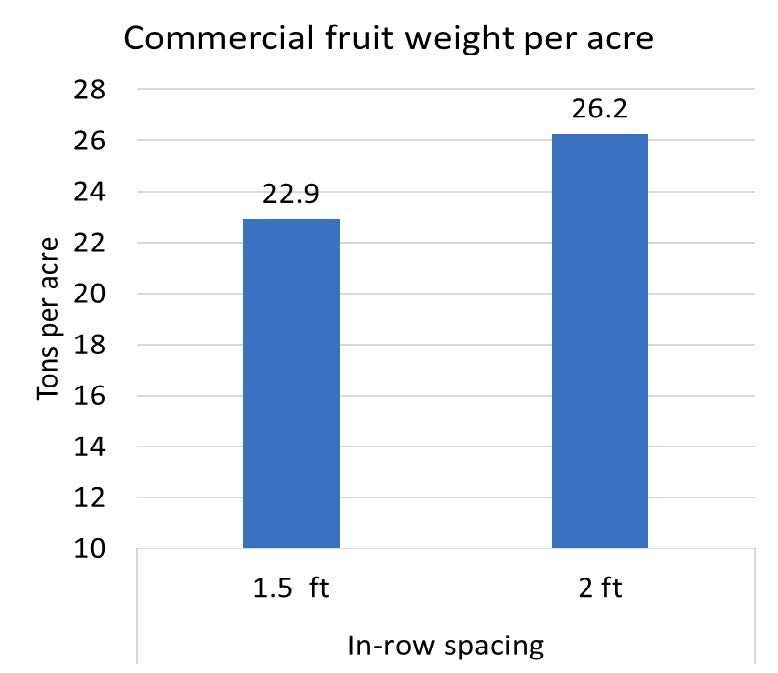
However, when analyzing the same data on a yield- per-area basis, things start to get confusing. This is because, although a higher plant density will often produce a lower yield per plant, it will also allow more plants to be established, which in terms, might compensate for the reduction in yield per individual plant (Figure 3). For example, a tomato plant might have a reduction in yield of 34% when planted at 1.5 ft of in-row spacing, compared to 2 ft. However, a 1.5 ft in-row spacing will increase plant population by 25% compared to a 2 ft in-row spacing, which helps alleviate the effect of the high planting density.
In many cases, the data analysis on a per-area basis will result in treatments showing no significant difference among them. Hence, the recommendation becomes a range of distances that should provide similar yields for farmers. Keeping this in mind, a farmer might believe that going with the lower density should result in the expected yield with the minimum possible investment in plant material. However, there is always risk in the extremes.
For example, a system with low-density planting, although less likely to be affected, could be susceptible to big economic losses if disease or insect pressure suddenly increases under the structure and plants are lost. Similarly, high planting recommendations could allow farmers to have extra plants in case of heavy pest pressure progress. Yet, that same high planting density will likely worsen pest pressure and create additional problems. The most adequate approach is to select your planting density within the recommended range and create a plan that allows you to be prepared for the potential risk that comes with your density selection.
Plant density pest and disease management implications
While plants grown under tunnels and greenhouses are protected from rain which usually mitigates the proliferation of fungal and bacterial diseases, it also creates a microclimate around the crop that is often optimal for the establishment of many arthropod pests. High plant density under protected structures can easily exacerbate pest infestations, especially under protected structures. For instance, protected structures can easily become dry, warm, and dusty structures optimal for two-spotted spider mites (Tetranychus urticae, Acari: Tetranychidae) development and reproduction. Many spider mite species infesting vegetable and fruit crops will benefit from these environmental conditions and dense canopies that allow them to easily colonize healthy plants.
Similarly, broad mite (Polyphagotarsonemus latus, Acari: Tarsonemidae), thrips (Thysanoptera: Thripidae), and whitefly (Hemiptera: Aleyrodidae) infestations can be more severe under protected structures compared to open field crops. However, their infestations can also become severe in open field plantings when refugia are created by dense plant canopy that limits pest elimination by pesticide sprays. Aiming to increase yield by increasing plant density, may exacerbate insect and mite pest infestations, risking the yield potential. Therefore, it is important to consider adequate plant densities in both open fields and protected cropping systems to guarantee the efficacy of pest management techniques such as pesticide applications.
Many of the common diseases that occur in field production can also be found in tunnels and greenhouses. In protected production structures, dense plantings can promote disease development. High relative humidity in the plant canopy is favorable to many foliar plant pathogens that cause diseases such as downy mildew, powdery mildew, grey mold, leaf mold, early blight, and late blight. Growing media that remains saturated for extended periods creates conditions conducive to water molds such as Phytophthora and Pythium. In addition, overcrowding permits diseases that are dispersed by splashing water, such as bacterial speck and spot, to easily move among plants.
Special consideration is needed to mitigate disease conditions in protected production structures. Efforts should focus on reducing relative humidity, avoid overwatering, and protect plants from disease spread. Highly susceptible crops will likely need to be protected with fungicides. However, certain fungicides are not allowed in greenhouses or “enclosed space production”. Remember that the pesticide label is the legal document on pesticide use. Read the label and follow all instructions closely checking specifically for restriction statements, permitted target crops or crop stages, and safety and use requirements.
Take home message
In summary, the selection of any production practice (e.g., plant density, pruning, planting date, etc.) should be considered in the overall application of the production system. Each of these practices will continuously interact with each other and will be affected by the growing conditions around the crop. Therefore, cultural practices should not be arbitrarily definite without consideration for the rest of the system. Planting density selection will have a big influence on the overall profitability of your system. Establish too few plants and you could be reducing the yield potential of your area and excessively applying water and fertilizer. Conversely, establish too many plants and you will likely reduce the overall production potential of each plant and make your system more susceptible to pest pressure and therefore lose yield per unit area. Make your selection from research-based recommendations for your region and rely on your extension agents and specialist to answer any doubts that you might have about your production system and your protective structure.
| Crop | Space between bed (inches) |
In-row spacing (inches) |
No. of planting rows | Plant per square meter | Growing habit | System description | Reference |
|---|---|---|---|---|---|---|---|
| Cucumber | 72-96 | 9-12 | 1-2 | 2.39-2.69 | Determinate | Open field | Mid-Atlantic commercial vegetable production guide 2021-22 |
| Muskmelon | 60-72 | 24-36 | 1 | 1.07-0.59 | Determinate | Open field | Mid-Atlantic commercial vegetable production guide 2021-22 |
| Bell Pepper | 48-60 | 12-18 | 1-2 | 2.69-2.87 | Determinate | Open field | Mid-Atlantic commercial vegetable production guide 2021-22 |
| Strawberry | 48 | 12-16 | 2-4 | 5.38-8.07 | Determinate | Open field | Mid-Atlantic commercial vegetable production guide 2021-22 |
| Tomato | 60-72 | 18-24 | 1 | 1.43-0.89 | Determinate | Open field | Mid-Atlantic commercial vegetable production guide 2021-22 |
| Crop | Space between bed (inches) |
In-row spacing (inches) |
No. of planting rows | Plant per square meter | Growing habit | System description | Reference |
|---|---|---|---|---|---|---|---|
| Cucumber | 32 | 22 | 1 | 2.55 | Indeterminate | Greenhouse1 | Ding et al., 2022; |
| Cucumber | 71 | 10 | 1 | 2.22 | Indeterminate | Greenhouse | Ayala-Tafoya et al., 2019. |
| Muskmelon | 48 | 10 | 1 | 3.33 | Indeterminate | Greenhouse | Rodriguez et al., 2007 |
| Muskmelon | 40-48 | 24-26 | 1 | 1.61-1.24 | Indeterminate | High tunnel2 | Jett, 2022. |
| Bell Pepper | 48 | 10 | 1 | 3.23 | Determinate | High tunnel | Torres-Quezada et al., 2021 |
| Bell Pepper | 52 | 20 | 1 | 1.5 | Indeterminate | Greenhouse | Jovicich et al., 2004 |
| Bell Pepper | 52 | 8 | 1 | 3.8 | Indeterminate | Greenhouse | Jovicich et al., 2003 |
| Strawberry | 18-22 | 7 | 1 | 10.2-12.3 | Determinate | Greenhouse | Paranjpe et al., 2003 |
| Strawberry | 48 | 12-15 | 2-4 | 5.4-10.7 | Determinate | High tunnel | Rowley et al., 2010 |
| Tomato | 48 | 12 | 2 | 5.4 | Indeterminate | Greenhouse | Amundson et al., 2012 |
| Tomato | - | 12 | 1 | 4 | Indeterminate | Greenhouse | Carrillo et al., 2003 |
| Tomato | - | - | - | 3.78 | Indeterminate | Greenhouse | Grijalva-Contreras et at., 2004 |
| Tomato | - | 12 | 2 | 3.78 | Indeterminate | Greenhouse | Grijalva-Contreras et al., 2010 |
| Tomato | - | - | - | 3.3 | Indeterminate | Greenhouse | Gunnlaugsson et al., 2006 |
| Tomato |
60 | 15 | 2 | 3 | Indeterminate | Greenhouse | Hochmuth, 2018 |
| Tomato |
- | 18-24 | 1 | - | Determinate | High tunnel | Lamont et al., 2003 |
1 Might include leaf, shot, and fruit pruning, trellising, smaller planting beds (hydroponics), higher fertilization rate, and longer seasons;
2 Production practices are similar to open field systems.
References
Amundson, S., D.E. Deyton, D.A. Kopsell, W. Hitch, A. Moore, and C.E. Sams. 2012. Optimizing Plant Density and Production Systems to Mazimize yield of greenhouse grown "Trust" Tomatoes. HortTechnology 22(1):44-48.
Ayala-Tafoya, F. C.A. Lopez-orona, M.G. Yanez- Juarez, T. Diaz-Valdez, T, Velazquez-Alcaraz, J.M. Parra Delgado. 2019. Plant density and stem pruning in greenhouse cucumber production. Revista Mexicana de Ciencias Agricolas 10(1):79-90
Black, C.A. 1957. Soil-plant relationships. 1st ed. John Wiley Sons, New York, N.Y.
Carrillo, J.C., F. Jimenez, J. Ruiz, G. Diaz, P. Sanchez, C. Perales, A. Arellanes. 2003. Evaluación de densidades de siembra en tomate (Lycopersicon esculentum Mill) en invernadero. Agronomia Mesoamericana 14(1):85-88.
Ding, X., W. Nie, T. Qian, L. He, H. Zhang, H. Jin, J. Cui, H. Wang, Q. Zhou, and J. Yu. 2022. Low plant density improves fruit quality without affecting yield of cucumber in different cultivation periods in greenhouse. Agronomy 12(6):1441-1455.
Francis, R., and D.R. Decoteau. 1993. Developing an effective southern pea and sweet corn intercrop system. HortTechnology 3(2):178-184.
Giacomelli, G.A., and W.J. Robert. 1993. Greenhouse covering systems. HortTechnology 3(1):50–58.
Grijalva-Contreras, R.L., R. Macias-Duarte, M. Valenzuela-Ruiz, and F. Robles-Contreras. 2004. Influence of plant density on yield and quality in tomatoes under greenhouse conditions in the Nortwest on Mexico (abstract). HortScience, 39(4):801-802.
Grijalva-Contreras, R.L., R. Macias-Duarte, S.A. Grijalva Duron, and F. Robles-Contreras. 2010. Evaluación de densidades y arreglos de plantación en tomate bola en condiciones de invernadero en el Noroeste de Sonora. Biotecnica 11(2):20-28.
Gunnlaugsson, B. and S. Adalsteinsson. 2006. Interlight and plant density in year-round production of tomato at Northern latitudes. Acta Hortic. 711, 71-76
Hochmuth, G.J. 2018. Production of Greenhouse Tomatoes—Florida Greenhouse Vegetable Production Handbook, Vol 31. University of Florida, IFAS. Available at <https://edis.ifas.ufl.edu/pdf/CV/CV266/CV266- 4429807.pdf>.
Jett, W. 2022. High tunnel melon and watermelon production. Extension University of Missouri. <https://extension.missouri.edu/publications/m173?p=1>.
Jovicich, E., D.J. Cantliffe, and P.J. Stoffella. 2004. Fruit yield and quality of greenhouse-grown bell pepper as influenced by density, container, and trellis system. HortTechnology 14(4):507-513.
Jovicich, E., D.J. Cantliffe, and P.J. Stoffella. 2003. "Spanish" pepper trellis system and high plant density can increase fruit yield, fruit quality, and reduce labor in a hydroponic, passive ventilated greenhouse. ISHS Acta Horticulturae 614: VI International Symposium on Protected Cultivation in Mild Winter Climate: Product and Process Innovation
Lamont Jr., W.J., M.D. Orzolek, E.J. Holcomb, K. Demchak, E. Burkhart, L. White, and B. Dye. 2003. Production system for horticultural crops grown in the Penn State High Tunnel. HortTechnology 13(2):358-362.
Paranjpe, A.V., D.J. Cantliffe, E.M. Lamb, P.J. Stoffella, C. Powell. 2003. Winter strawberry production in greenhouses using soilless substrates: an alternative to methyl bromide soil fumigation. Proc. Fla. State Hort. Soc. 116:98- 105.
Rodriguez, J.C., N.L. Shaw, and D.J. Cantliffe. 2007. Influence of plant density on yield and fruit quality of greenhouse-grown Galia muskmelon. HortTechnology 17(4):580-585.
Rowley, D. B. Black, and D. Drost. 2010. High tunnel strawberry production. UtahState University cooperative extension. <https://www.sare.org/wp-content/uploads/High-Tunnel-Strawberry-Production.pdf>.
Torres-Quezada, E., L. Zotarelli, D.D. Treadwell, B.M. Santos. 2021. Growth habit and in-row distance for bell pepper under protected culture. International Journal of Vegetable Science 27(6):561-573.
Wilson, S.D., and D. Tilman. 1993. Plant competition and resource availability in response to disturbance and fertilization. Ecology 74(2):599-611.
Wyzgolik, G., J. Nawara, and M. Leja. 2008. Photosynthesis and some growth parameters of sweet pepper grown under different light conditions. Sodininkystė ir Daržininkystė 27(2):93-98.
Virginia Cooperative Extension materials are available for public use, reprint, or citation without further permission, provided the use includes credit to the author and to Virginia Cooperative Extension, Virginia Tech, and Virginia State University.
Virginia Cooperative Extension is a partnership of Virginia Tech, Virginia State University, the U.S. Department of Agriculture (USDA), and local governments, and is an equal opportunity employer. For the full non-discrimination statement, please visit ext.vt.edu/accessibility.
Publication Date
February 2, 2023