Understanding Salinity in Tidal Waters: Information for Irrigators
ID
BSE-349P
Introduction
Many irrigation sources in coastal areas have the potential to become high in salinity from time to time. This can occur in both tidal rivers and coastal groundwater wells. Even farm ponds that are normally fresh can become saline after coastal flooding events. At times, salinity levels can become high enough to cause noticeable damage to irrigated crops. Crop damage can occur from prolonged exposure to saline water or from a single event if salinity levels are high enough. Water bodies with variable salinity levels can still serve as an effective source of irrigation water as long as salinity risks are managed to avoid crop damage. Understanding the periods when salinity levels are likely to be high can help irrigators avoid salinity damage.
This Virginia Cooperative Extension bulletin aims to provide information about what factors influence salinity in tidal rivers and strategies irrigators can use to monitor salinity in their sources of irrigation water. It also presents an analysis of salinity sampling data from tidal portions of the Rappahannock River and neighboring streams. While general patterns observed in the Rappahannock River would be expected to occur in other tidal rivers, the specific sampling results and flow data presented here apply only to the Rappahannock River. For more information on potential salinity issues in groundwater wells, readers can refer to VCE publication BSE-215P, “Using Groundwater for Agricultural Irrigation in Virginia” (https://www.pubs. ext.vt.edu/BSE/BSE-215P/BSE-215P.html) (Shortridge 2017). More information on irrigation salinity thresholds for different crops is in VCE publication BSE-348P,
Understanding Salinity
Salinity refers to dissolved ions (molecules that carry an electric charge) in water or soils. Fresh water has few dissolved ions; saline water contains more dissolved ions. Salinity in irrigation water can be categorically classified based on its EC or TDS levels (table 1). Total dissolved solids (TDS) is a measurement of the mass of dissolved solids in the water, including salts, that can pass through a two-micron filter. TDS is reported in units of milligrams per liter (mg/L) or parts per mil- lion (ppm). Because dissolved salt is a good conductor of electricity, salinity levels can also be estimated by measuring the amount of electricity that a water sample can conduct across a unit length. Units for measuring salinity in irrigation water using electrical conductivity (EC) are decisiemens per meter (dS/m) or millisiemens per centimeter (mS/cm) (Fipps 2003).
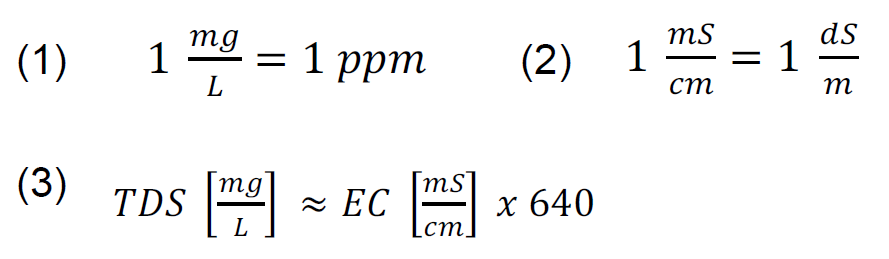
When comparing salinity data to crop thresholds, it may be necessary to convert salinity measurements between different units. To convert salinity readings between different units, the below equations can be used. The units of mg/L and ppm units are roughly equivalent and can be directly compared to each other (equation 1). The units of dS/m and mS/cm are also equivalent to each other, and are the primary units discussed in this bulletin (equation 2). Salinity measurements in mS/cm can be roughly converted to ppm by multiplying the mS/ cm reading by 640 (equation 3). This is an approximate conversion because the exact relationship depends on the specific ions present.
Salinity rating |
EC (mS/cm) |
TDS (PPM) |
|---|---|---|
Non-saline |
< 0.70 |
<500 |
Slightly saline |
0.70 – 2.00 |
500 – 1,500 |
Moderately saline |
2.00 – 10.0 |
1,500 – 7,000 |
Highly saline |
10.0 – 20.50 |
7,000 – 15,000 |
Very highly saline |
20.50 – 45.00 |
15,000 – 35,000 |
Brine |
>45.00 |
>35,000 |
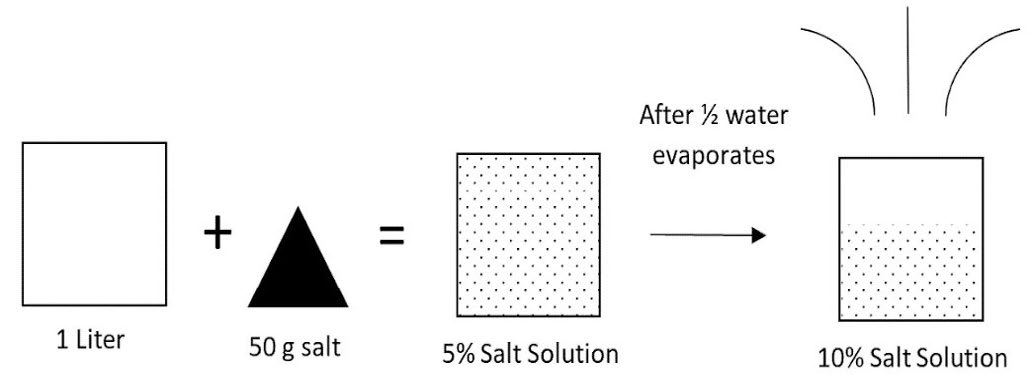
Salinity levels fluctuate naturally in tidal rivers. This can be related to water level, upstream sources of salts, runoff, and other factors. Additional concerns with salinity levels are emerging due to sea-level rise attributed to climate change. Rising sea levels can push saltwater further upstream in tidal rivers than in previous years. Another factor responsible for increased salinity levels is evaporation. Warmer temperatures increase evaporation from the surface of water. As a body of water loses moisture through evaporation, dissolved minerals are left behind. So, increased evaporation can intensify the concentration of salts in water that may be used for irrigation (figure 1).
Rappahannock River Salinity Study
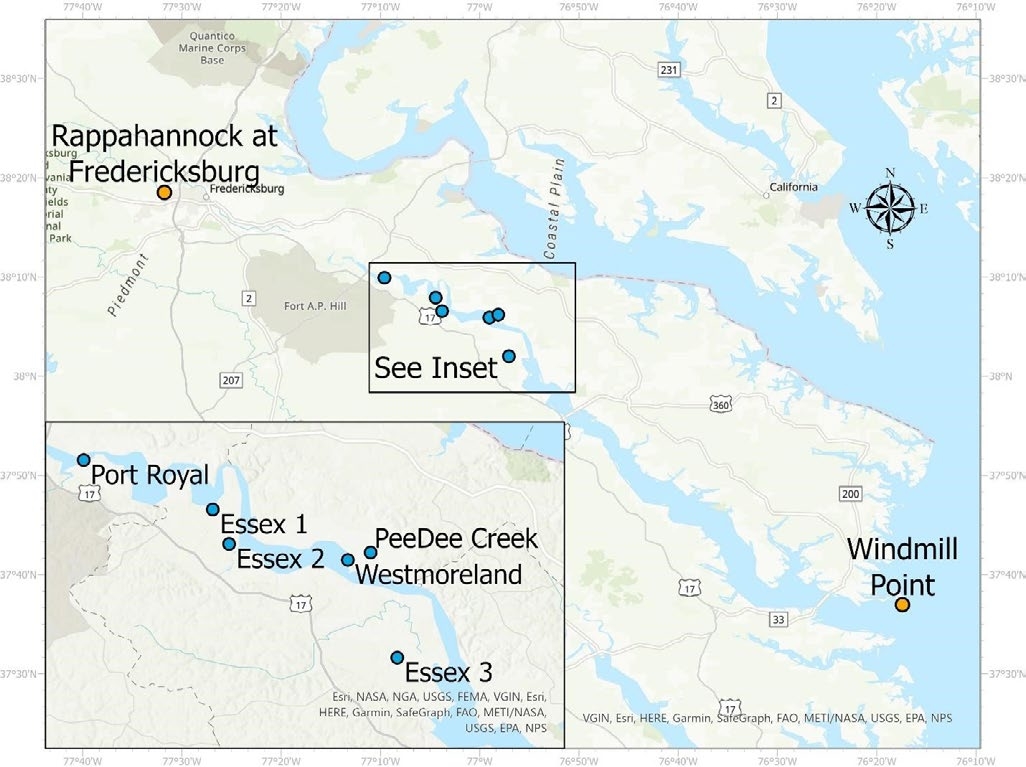
To demonstrate how different conditions can influence salinity levels in tidal rivers, we collected samples from the Rappahannock River and measured their salinity, comparing the results to river discharge and tide levels. The Rappahannock River is a tidally influenced river that flows into the Chesapeake Bay. In 2020, five sites were sampled for salinity. In 2021, two of those sites were sampled again, along with an additional site (Peedee Creek) (figure 2). All sampling locations except Peedee Creek were located on the main stem of the Rappahannock River. The Peedee Creek sampling location was just upstream of where the creek flows into the Rappahannock, near Westmoreland. We measured salinity levels using a calibrated handheld Hanna HI 9811 salinity meter. Samples were collected weekly between June and August in 2020 and between June and October in 2021. We obtained tide level data from the National Oceanic and Atmospheric Administration’s Windmill Point tide station, located at the mouth of the Rappahannock River. River discharge data was collected from the U.S. Geological Survey’s Rappahannock River station near Fredericksburg, upstream of the salinity sample collection locations. River discharge refers to the volume of water flowing in the river and corresponds with river levels.
Salinity Sampling Results
Table 2 shows a statistical summary of the salinity levels at the sample sites for the two years data was collected. Three locations (Essex 1, Essex 2, and Port Royal) did not show any significant salinity levels in 2020. For this reason, they were not sampled in 2021. In general, salinity levels were higher at downstream sampling locations located closer to the mouth of the river. The highest salinity concentrations were found in samples from the Essex 3 location and the lowest were from Port Royal.
Location |
Year |
Salinity (mS/cm) |
||
|---|---|---|---|---|
Mean |
Median |
Range |
||
Port Royal |
2020 |
0.073 |
0.070 |
0.05 - 0.09 |
Essex 1 |
2020 |
0.097 |
0.100 |
0.08 - 0.12 |
Essex 2 |
2020 |
0.110 |
0.060 |
0.05 - 0.33 |
PeeDee Creek |
2021 |
0.320 |
0.215 |
0.12 - 1.25 |
Westmoreland |
2020 |
0.200 |
0.100 |
0.07 - 0.68 |
2021 |
0.370 |
0.220 |
0.07 - 0.98 |
|
Essex 3 |
2020 |
0.690 |
0.200 |
0.11 - 2.55 |
2021 |
1.100 |
1.070 |
0.31 - 1.58 |
|
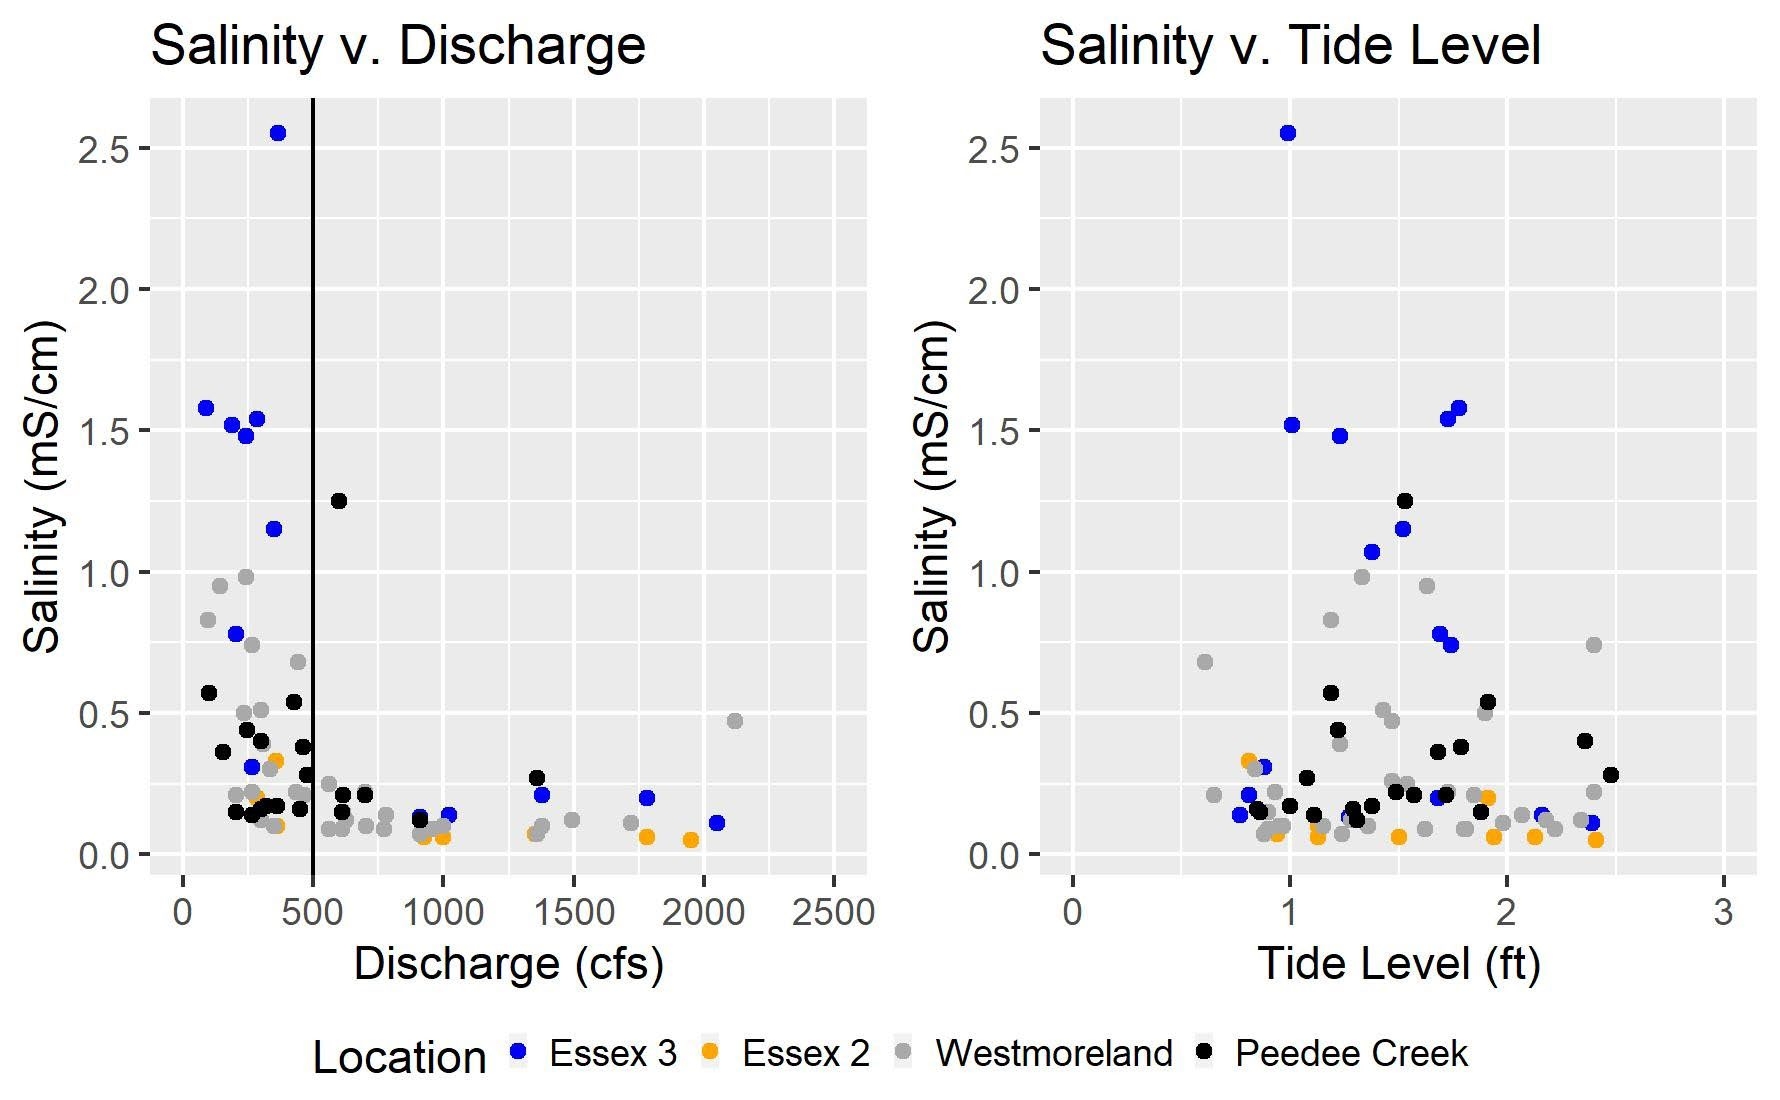
Figure 3 shows how salinity measurements at six of the eight sampling sites compare with river discharge and tide levels. Because salinity levels at the Port Royal and Essex 1 sites were very low, they were not included in figure 3. Results indicate that high salinity levels typically occurred during low discharge periods as measured at the Fredericksburg station. The threshold level appears to be a discharge of around 500 cubic feet per second on the main stem of the Rappahannock River, which is indicated on the Salinity v. Discharge graph with a vertical line. When the discharge drops below 500 cfs, salinity levels at the downstream sampling locations rose. Salinity levels downstream changed more than salinity levels upstream, likely due to their proximity to the Chesapeake Bay. Salinity readings were also compared to tide level readings at the Windmill Point station at the mouth of the Rappahannock River, but there was no significant relationship between salinity and tide level in this study. This suggests that river levels can provide more information about potential salinity problems at our sample locations than tide levels.

Historical Rappahannock River Levels
After analyzing salinity samples, we evaluated historic data from the Rappahannock River station to determine average flow rates and how often discharge levels drop below 500 cfs. This could be used to predict times when salinity levels could potentially be high. Data from the USGS station at the Rappahannock River at Fredericksburg is available from 1907 to the present.
Figure 4 shows a graph of the median discharge values for each month of the year. The highest discharge values occur in the spring after snowmelt, and the lowest discharge occurs in the late summer to early fall. This seasonal pattern is similar in most Virginia rivers. Historically, river flow in the Rappahannock between August and October has been below 500 cfs in about half the years. This indicates that for the portion of the Rappahannock that was sampled, higher salinity levels should be expected during the same periods when crops require the most water, and that during the late summer and early fall, water salinity should be considered when using this portion of the Rappahannock River as an irrigation source.
River discharge levels can fluctuate significantly from day to day. For a closer look at daily river discharge in the Rappahannock, we examined levels in 2020 and 2021, the years in which salinity samples were collected, as well as 2002, a historically dry year in Virginia. In 2002, the Fredericksburg station saw the lowest flows since the station began operating in 1907. Figure 5 shows the discharge data from May through September in 2002, 2020, and 2021.
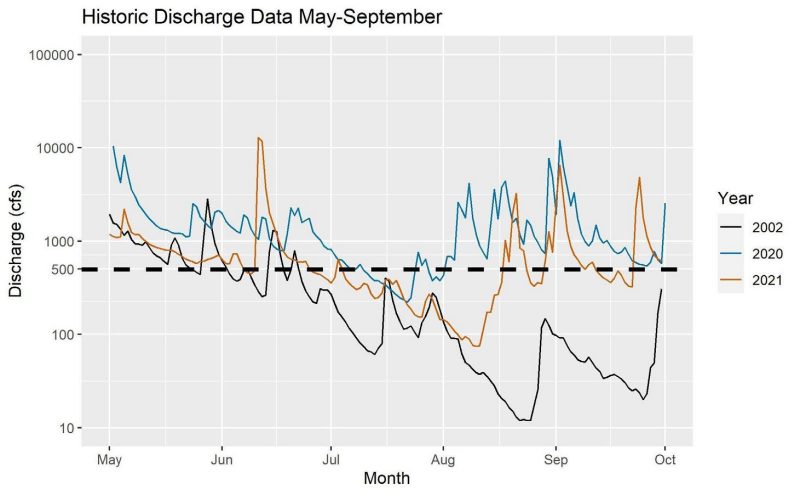
In 2002, the river was below 500 cfs (dashed line) from the second half of June through the beginning of October. While 2002 was a historic drought year, there was a significant period in both 2020 and 2021 when the daily discharge dropped below 500 cfs. In 2020, the flow was below 500 cfs for approximately two weeks in mid-July. In 2021, this period was longer, lasting from July to mid- August. Even in years without severe drought conditions, it is possible to encounter times when irrigation sources may have higher salinity levels due to low river discharge. Understanding when these conditions are likely to occur can help irrigators avoid damaging their crops with saline irrigation water.
Monitoring Salinity in Irrigation Water Sources
In situations where irrigation water could be high in salinity, such as what might occur in tidal rivers, shallow groundwater wells, and farm ponds in coastal locations, growers can use both short-term and long-term strategies to avoid salinity damage to their crops. The first step is to understand salinity levels in water sources and how these levels might change over time. Salinity levels can be measured using handheld meters or by sending a water sample to a lab. Labs will generally provide more accurate measurements than handheld meters but have a downside in that they only provide a snapshot of the time when the sample was collected. There will also be a time delay between sample collection and the time when results are provided by the lab, and salinity concentrations could change during this time. Because of this, they are a better choice for water sources where salinity levels are expected to be relatively constant, such as a groundwater well that does not experience large changes in water level through the season. For surface water sources, multiple samples will likely be needed to capture periods of high and low salinity, and so the convenience of using handheld meters would offset the lower level of accuracy that might occur.
In locations where river salinity levels may occasionally exceed thresholds known to cause crop damage (such as the Rappahannock River locations discussed below), river levels can be monitored to avoid irrigating with saline water. For instance, if salinity levels in the source river are declining and no rainfall is in the forecast, growers could irrigate a few days before necessary to avoid needing to irrigate when salinity levels would likely become higher.
While this document primarily discusses short-term changes in salinity, other issues can create longer- lasting salinity problems as well. For instance, coastal groundwater wells that have a declining water level could see gradual rising salinity levels due to saltwater intrusion. In addition, upstream surface water withdrawals that permanently lower discharge levels could create long-term increases in salinity levels. Sea level rise can make both of these problems worse. In water sources where salinity levels are expected to stay high, growers may need to consider augmenting their irrigation supplies with another freshwater source to avoid salinity problems.
Summary
Ensuring that irrigation provides sufficient water to support crop growth can be challenging in locations where irrigation water sources have high salinity concentrations. Saline irrigation water that is applied to crops can result in noticeable impacts to plant health and growth. To avoid this damage, irrigators should understand the factors that influence salinity. In tidally influenced surface water bodies such as rivers and creeks, salinity levels will likely change through time due to factors such as tide levels and river flows. In a study of the Rappahannock River, we found that salinity concentrations were higher in the downstream portions of the river and tended to increase when river discharge levels were below 500 cubic feet per second. The general pattern of higher salinity concentrations in downstream locations during times of low river flows is likely to be common in many tidal locations, even if the specific threshold of 500 cfs would only apply to the sampled locations in the Rappahannock. In our samples, we found little relationship between tide levels and salinity concentrations, but this could be different in other locations. If growers suspect that salinity levels may be high in their irrigation water sources, they can use handheld samplers or laboratory analyses to determine salinity levels, and then take action to reduce the possibility of a high-saline irrigation source from damaging their crops.
Acknowledgements
We thank the following growers who allowed us to collect salinity samples on their farms: Gary Allensworth, Buster Sanford, Cloverfield Enterprises, and Mill Creek Farms at Camden. We also acknowledge Westmoreland/ Richmond County Extension interns Skylar Swann and Clare Tallamy for their assistance in collecting salinity samples. We acknowledge the following peer reviewers, whose thoughtful comments greatly improved this document: Michael Broaddus, Unit Coordinator and Caroline County Extension agent, Virginia Cooperative Extension; Teresa Pittman, Accomack County Extension agent, Virginia Cooperative Extension; Dr. Mark Reiter, professor of Soils and Nutrient Management, Virginia Tech; and Dr. Lincoln Zotarelli, associate professor of Horticultural Sciences, University of Florida.
References
Fipps, G. 2003. Irrigation Water Quality Standards and Salinity Management. Publication B-1667. Texas A&M AgriLife Extension, College Station, Texas. https://lubbock.tamu.edu/programs/disciplines/ irrigation-water/salinity-and-irrigation-water-quality/.
Larsson, N., J. Shortridge, and E. Torres Quezada. 2023. Managing Irrigation with Saline Water. VCE Publication BSE-348P. Virginia Cooperative Extension, Blacksburg.
Shortridge, J. 2017. Using Groundwater for Agricultural Irrigation in Virginia. VCE Publication BSE-215P. Virginia Cooperative Extension, Blacksburg. https://www.pubs.ext.vt.edu/BSE/BSE-215P/BSE-215P. html.
![]() Yadav, S., M. Irfan, A. Ahmad, and S. Hayat. 2011. “Causes of Salinity and Plant Manifestations to Salt Stress: A Review.” Journal of Environmental Biology, 32(5), 667-85. https://www.researchgate.net/publication/221818713_Causes_of_salinity_and_plant_manifestations_to_salt_stress_A_ review.
Yadav, S., M. Irfan, A. Ahmad, and S. Hayat. 2011. “Causes of Salinity and Plant Manifestations to Salt Stress: A Review.” Journal of Environmental Biology, 32(5), 667-85. https://www.researchgate.net/publication/221818713_Causes_of_salinity_and_plant_manifestations_to_salt_stress_A_ review.
Virginia Cooperative Extension materials are available for public use, reprint, or citation without further permission, provided the use includes credit to the author and to Virginia Cooperative Extension, Virginia Tech, and Virginia State University.
Virginia Cooperative Extension is a partnership of Virginia Tech, Virginia State University, the U.S. Department of Agriculture (USDA), and local governments, and is an equal opportunity employer. For the full non-discrimination statement, please visit ext.vt.edu/accessibility.
Publication Date
May 11, 2023