A characterization of large-scale swine production and manure generation in Virginia counties and cities located within or outside of the Chesapeake Bay Watershed
ID
APSC-182P
 EXPERT REVIEWED
The Chesapeake Bay watershed encompasses all of the District of Columbia and portions of six states, including Virginia (Beegle 2013). Economies of many communities in the region depend on commercial and recreational fishing and the tourism opportunities the bay provides. For example, the harvest of blue crabs and oysters just in the Virginia and Maryland portions of the bay generate over $144 million in annual sales and thousands of jobs (National Marine Fisheries Service 2018). However, various pollutants, such as industrial chemicals, nutrients, and sediment, threaten the plants and animals native to the region. Forests, followed by agriculture, are the major land uses, with various types of farming occurring on approximately 22% of land in the watershed (Kaufman et al. 2014). Crops raised in the watershed include but are not limited to hay, corn, soybeans, and small grains. The principal food animal operations in the region include dairy, beef, swine, and poultry (Keisman et al. 2018).
Agriculture is important for providing food and fiber and for economic support of rural communities. However, agriculture is also the largest source of nutrients and sediment entering the Chesapeake Bay, accounting for an estimated 42% of nitrogen, 55% of phosphorous and 60% of sediment loads (U.S. Environmental Protection Agency 2021). In collaboration with the U.S. EPA, each of the six Chesapeake Bay states developed watershed implementation plans that describe specific methods of reducing the nitrogen, phosphorous, and sediment loads from agriculture. Mathematical models employed to predict the quantity and fate of nutrients generated by the various land uses are among tools used to determine success in reducing pollutants entering the bay.
The livestock and poultry populations used in the models generally reflect census data that the U.S. Department of Agriculture’s National Agricultural Statistics Service collects at the county level every five years. The NASS cannot disclose information that would allow a reader to determine information such as inventory and sales for an individual farm. Thus, data for some counties within the bay watershed are oftentimes not reported, which skews the results. Sources of more accurate production and inventory data would allow truer representation of commercial livestock and poultry production in the Chesapeake Bay watershed and consequently more valid decision support tools, including models.
Commercial swine farms in Virginia are widely dispersed among counties both within and outside of the Chesapeake Bay watershed. The study described here was designed to characterize animal numbers and manure nutrient generation for segments of Virginia’s commercial swine industry and to begin building a database that can facilitate creating mathematical models that various groups can use as decision-making tools. Our focus was on large farms (those with inventory or sales of 1,000 head or more annually), including company-owned and operated farms and contractor farms characteristic of the vertically integrated swine industry.
Methods
Swine farm data for Virginia on the statewide and county levels were extracted from the U.S. Department of Agriculture Census of Agriculture for 1974, 1978, 1982, 1987, 1992, 1997, 2002, 2007, 2012, and 2017 (USDA), and the number of farms with sales of hogs and pigs, and number of animals sold were recorded. The census is published by the USDA’s NASS. Other data sources included swine numbers and manure management records supplied by a local integrator for company-owned wean-to-finish and grow-finish farms during 2017, 2018, 2019, and 2020. Also used were integrator production data from 2017 and manure management records from 2017, 2018, 2019, and 2020 for contract swine farms with nutrient management plans approved by the Virginia Department of Conservation and Recreation, as required by the Virginia Department of Environmental Quality for Virginia pollution abatement permits.
Statistical analyses
Where appropriate, data were subjected to repeated measures analysis of variance using the mixed-models procedure of SAS Institute Inc. of Cary, North Carolina. Individual means were compared using the least-square means option with Tukey adjustments. We declared statistical significance at P < .05, and trends at P < .10.
Results and Discussion
The number of farms with sales of hogs and pigs and the number of animals sold for Virginia were first determined using USDA Census of Agriculture data for 1974, 1978, 1982, 1987, 1992, 1997, 2002, 2007, 2012, and 2017 (fig. 1).
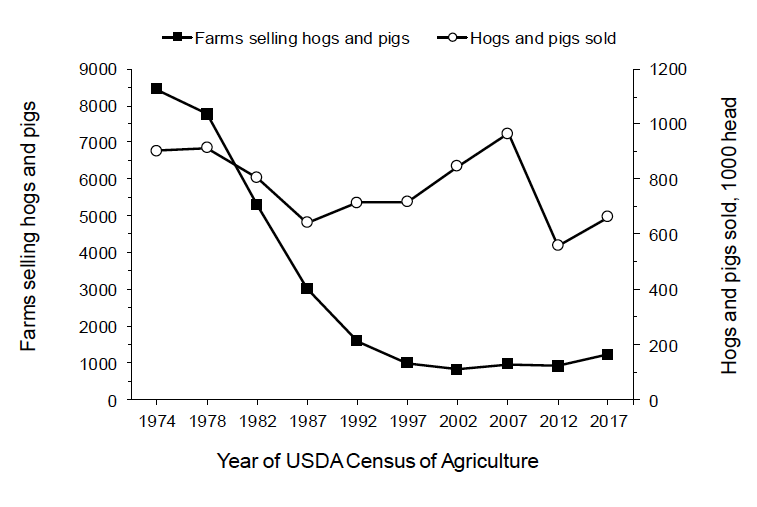
Between 1974 and 2002, the number of Virginia farms selling hogs and pigs decreased by over 90%. During this period, however, the total number of hogs and pigs sold in the commonwealth decreased by only 6.2%. These numeric changes during the past four decades are consistent with those occurring in other states (Montefiore et al. 2022) and reflect expansion of the vertically integrated swine production model and the exodus of many independent pork producers from the industry. Vertically integrated pork production occurs when a single entity owns or controls more than one step in the production process, such as a processor owning production or milling facilities, or both, that supply farmers raising hogs on contract.
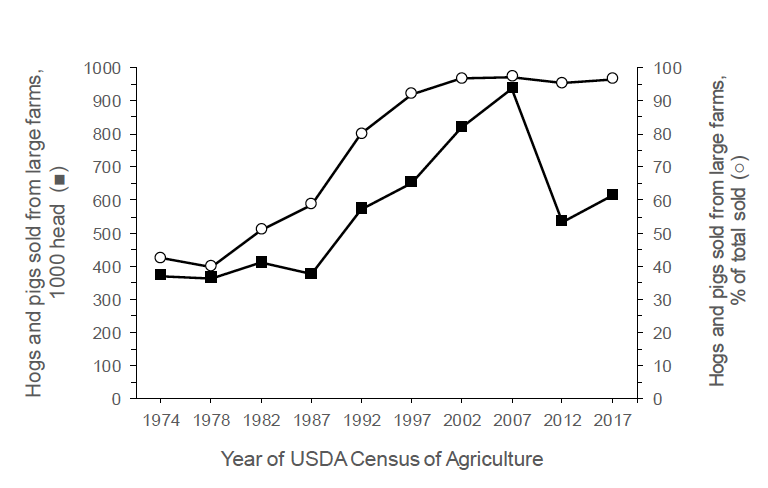
That the number of hogs and pigs sold in Virginia declined by only 6.2%, despite a dramatic decrease in the number of farms during this era, reflects growth in the number of large, concentrated animal feeding operations. Indeed, between 1974 and 2007, the number of hogs and pigs sold from farms marketing 1,000 or more animals annually increased approximately 153%, and that number, as a percentage of the state total increased from approximately 43% to over 97% (fig. 2). The decrease in the total number of hogs and pigs sold between 2007 and 2012 likely reflects the fact that around this time, many large-scale farrow-to-finish operations in Virginia were depopulated and subsequently renovated into wean-to-finish farms. Accordingly, the sale of hogs and pigs increased from 2012 to 2017.
Since 2002, the number of farms in Virginia has increased by 49% (from 834 to 1,244) and sales of hogs and pigs have decreased by 22% (847,000 to 664,000) (figure 1). These changes are consistent with the reemergence of small pig farms selling pork into niche markets focused on consumers desiring meat from animals with certain genetics (for example, Berkshire) that are raised locally using outdoor or other less intensive production systems (Honeyman et al. 2006). Regardless, 2017 census data indicates that integrators and contract growers sold 626,950 hogs and pigs, representing over 94% of the Virginia total.
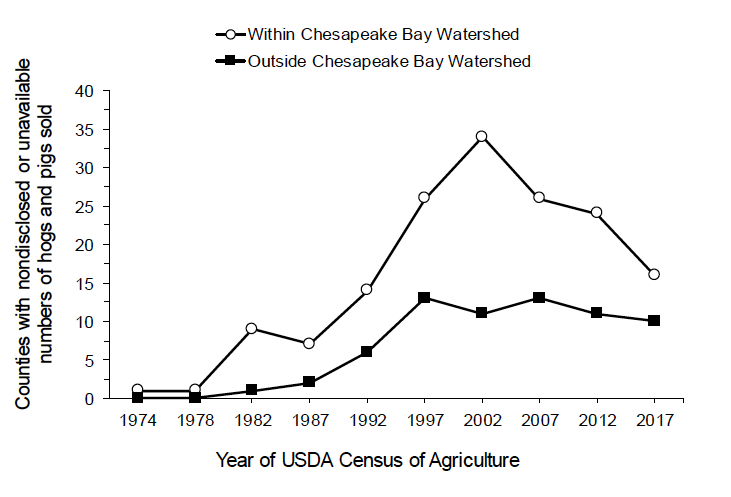
When publishing the Census of Agriculture, USDA NASS does not disclose information that would allow a reader to determine information such as sales of hogs and pigs from an individual farm. Thus, data for some counties and cities are often times not reported. Shown in figure 3 are the numbers of counties or cities with undisclosed or unavailable data (hogs and pigs sold) for each census from 1974 to 2017. It is evident that with consolidation of the swine industry, the number of counties both within and outside the Chesapeake Bay watershed with unreported data has increased. Moreover, using census data alone does not accurately capture the number of hogs and pigs produced in individual counties within the watershed.
Vertically integrated swine production in Virginia
Virginia Department of Conservation and Recreation and representatives of the vertically integrated swine industry supplied data for the company-owned and contract farms operating in Virginia. For 2017, the types of farms included boar stud (one farm), farrow-to-wean (two farms), nursery (six farms), wean-to-finish (16 farms), and grow-finish (32 farms). Sows are artificially inseminated using semen collected, processed and shipped from boar studs. Farrow-to-wean farms maintain a sow herd and at weaning, transport piglets farrowed on the premises to other farms. Nursery pig farms receive weaned pigs from farrow-to-wean farms and grow them for approximately seven weeks until shipping to grow-finish farms. Grow-finish farms receive pigs from a nursery farm and feed the animals until achieving market weights acceptable at slaughter plants. Wean-to-finish farms receive weaned pigs from farrow-to-wean farms and feed the animals until reaching slaughter weights. In Virginia, pigs on these farms were housed in environmentally-controlled barns and reared in pens with totally slatted floors. On almost all farms, manure collected in below-floor pits was removed for treatment and storage in earthen one- or two-cell lagoon systems. Contents of the lagoons were periodically sprayed on adjacent crop or hay fields, supplying nutrients and water.
For some corporate-owned and operated wean-to-finish and grow-finish farms, actual production data obtained for 2016, 2017, 2018, and 2019, is summarized in table 1. These farms each had a capacity of 14,500 head. Knauer and Hostetler (2013) reported the annual number of “turns” (the number of times farms were emptied and restocked) for wean-to-finish and grow-finish farms was 2.1 and 2.7, respectively. Thus, the maximum output for 14,500-head wean-to-finish farms would be 30,450 and for grow-finish farms, 39,150. Placements and the number of animals marketed varied significantly with year for the farms represented in table 1. That the average number of hogs marketed annually for wean-to-finish and grow-finish were approximately 20,000 and 17,000, however, indicates that these units operated well below capacity during this period.
Table 1. Effects of farm type (grow-finish or wean-to-finish) and year on production characteristics of Virginia swine farms.

1 Farm type x Year, P <.01
2 Farm type x Year, P =.02.
a,b For Year, means in a row with different superscripts differ (P <.05).
SE = Standard Error (measure of variability in data).
At placement on wean-to-finish farms, pigs approximately 3 weeks of age averaged 17 pounds each. Pigs from nursey units (generally about 10 weeks old) placed on grow-finish farms were significantly heavier, averaging almost 60 pounds. When marketed, hogs from grow-finish farms weighed slightly more than hogs from wean-to-finish units; however, total weight gain significantly favored the hogs from wean-to-finish farms. Overall body weights at placement and marketing varied by year. Staff members monitored farm water usage, allowing us to estimate manure production per pig (Brumm 2010). Manure production was significantly greater for wean-to-finish pigs versus grow-finish pigs but was similar across years from 2016 to 2020 (table 1).
Large-scale swine farms — those with inventory or sales of 1,000 head or more annually — in vertically integrated production systems operated during 2017 in seven counties (Buckingham, Charles City, Frederick, Isle of Wight, and Prince Edward) and one independent city (Suffolk) within the Chesapeake Bay watershed. Location of the swine farms within the Chesapeake Bay watershed was confirmed using the Virginia Department of Conservation and Recreation’s Hydrologic Unit Explorer (http://consapps.dcr.virginia.gov/htdocs/ maps/huexplorer.htm). For some counties, such as Isle of Wight, some but not all swine operations were within the Chesapeake Bay watershed. There were 10 counties (Brunswick, Charlotte, Dinwiddie, Greensville, Halifax, Isle of Wight, Pittsylvania, Southampton, Surry, Sussex) and one independent city lying outside of the Chesapeake Bay watershed in Virginia with large-scale, vertically integrated swine farms. Table 2 reveals that approximately 73% of the large-scale vertically integrated swine operations in Virginia were outside the Chesapeake Bay watershed, and these farms sold approximately 76% of the state’s hogs and pigs.
Table 2. Large-scale swine farms (integrator-owned and contract) operating during 2017 in Virginia counties and cities lying within or outside of the Chesapeake Bay watershed.

1 Number of Virginia counties and cities with large scale (inventory or sales of 1,000 head or more annually) producing pigs in vertically integrated systems.
2 Buckingham, Charles City, Frederick, Isle of Wight, and Prince Edward counties and the City of Suffolk.
3 Brunswick, Charlotte, Dinwiddie, Greensville, Halifax, Isle of Wight, Pittsylvania, Southampton, Surry, and Sussex counties, and the city of Virginia Beach.
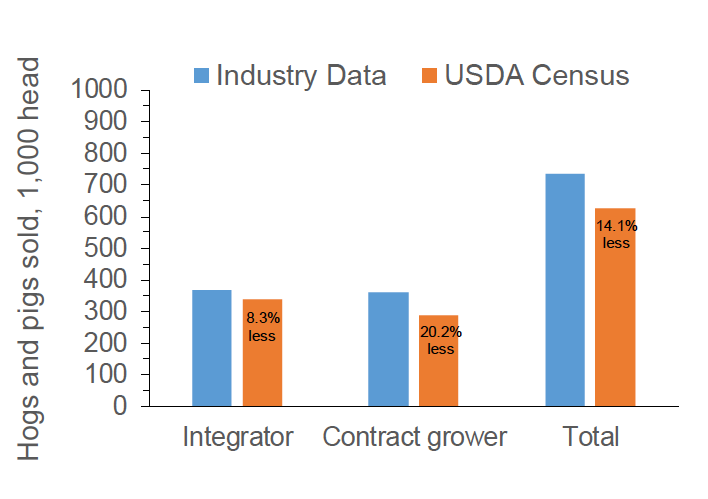
Virginia and the other Chesapeake Bay states maintain watershed implementation plans that describe specific methods of reducing the nitrogen, phosphorous, and sediment loads from agriculture. Mathematical models employed to predict the quantities and fate of nutrients generated by the various land uses determine the success of the plan’s methods in reducing pollutants entering the bay. As mentioned previously, sizes of swine populations used in the models generally reflect census data collected every five years by the USDA NASS. From a statewide perspective, 2017 data published by NASS underestimated swine production in Virginia (fig. 4). Although the causes of these discrepancies are unknown, it is evident that the differences between the data sources were larger for contract growers than for integrators.
Nutrient concentrations in manure produced on vertically integrated pig farms in Virginia
Manure samples collected from lagoons on 44 farms during the years 2017, 2018, 2019, and 2020 were analyzed for nutrient concentrations at Clemson University (Clemson, SC) using previously reported procedures (Peters et al. 2003). Concentrations of total Kjeldahl nitrogen (TKN), ammonium nitrogen (NH4-N), organic nitrogen (Org-N), phosphorous pentoxide (P2O5), potassium oxide (K2O), calcium (Ca), and magnesium (Mg) were determined. We used an average value for farms with multiple sample collections and analyses for the same year.
Table 3 shows nutrient concentrations in samples collected in 2017, 2018, 2019, and 2020 on wean-to-finish and grow-finish farms. Because there were only two farrow-to-wean and two nursery farms with manure sample analyses, those two types of operations were not included in this analysis. Across farm type, the concentrations of Org-N, P2O5, K2O and Mg were similar among years. In contrast, TKN and NH4-N increased from 2017 to 2020. Concentration of Ca increased from 2017 to 2018 and then decreased from 2019 to 2020.
Table 3. Nutrient concentrations in manure generated on swine farms (inventory or sales of 1,000 head or more) located within or outside of the Chesapeake Bay watershed in Virginia from 2017 to 2020.

a,b Within Year or Farm type, means in columns with different superscripts differ (P <.05).
SE = Standard Error (measure of variability in data).
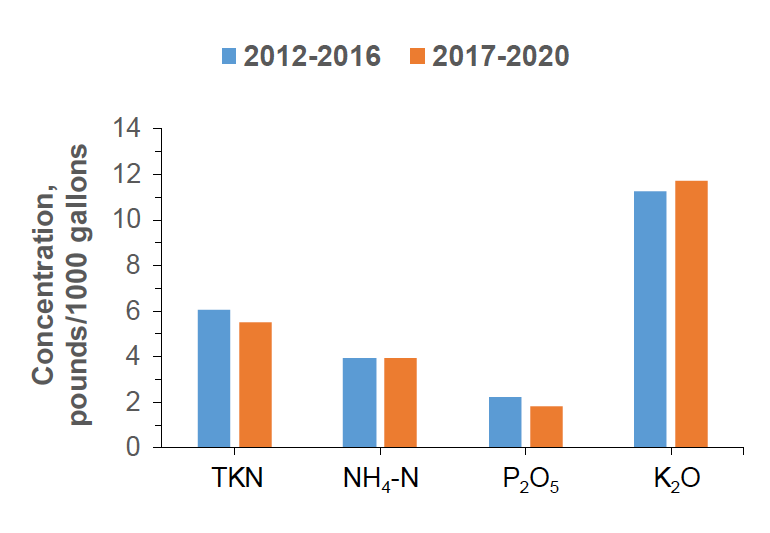
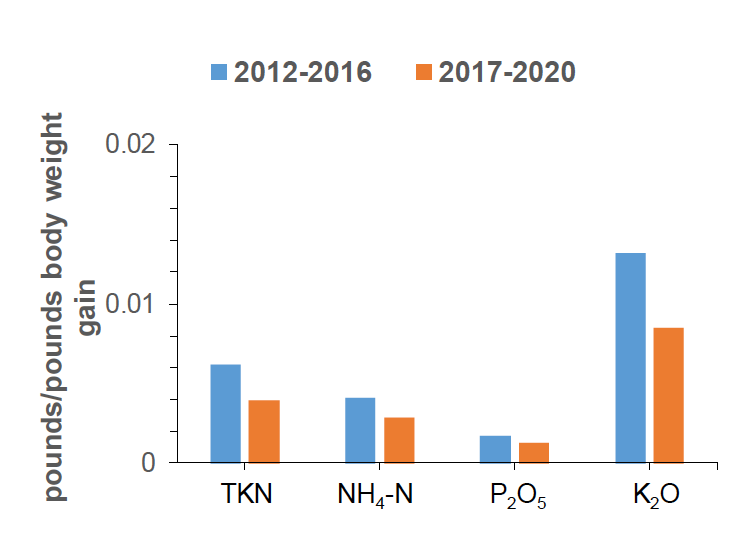
Figure 5 compares average nutrient concentrations in grow-finish farm manure for the period from 2017 to 2020 with Virginia data previously reported for the period from 2012 to 2016 (Estienne et al. 2016). Compared with the earlier reported values, NH4-N and K2O concentrations increased by 0.5% and 4.0%, respectively. In contrast, TKN and P2O5 decreased by 9.3% and 18%, respectively. Although we report here that TKN and P2O5 increased from 2017 to 2020 (table 3), when values were averaged across years, they were less than the values averaged across the years 2012 to 2016 (fig. 5) and previously reported by Estienne et al. (2016). Smith et al. (2017) also found that over time, concentrations of nitrogen in swine manure lagoons increased, but in contrast to our data, they also reported increases in P2O5 and K2O. Compared to 2012 to 2016 levels, 2017 to 2020 levels were less, when expressed as pounds of nutrients per pound of body weight gain, for TKN (by 35%), NH4-N (by 30%), P2O5 (by 24%), and K2O (36%) (fig. 6). These decreases are likely a consequence of advances in swine genetics and improved management and nutritional strategies in the pork industry (Pomar et al. 2021).
When comparing farm types, wean-to-finish farms had significantly greater concentrations of TKN, NH4-N, Org-N and Ca than grow-finish farms (Table 3). The concentrations of P2O5, K2O, and Mg differed numerically, but not statistically, between farm types. DeRouchey et al. (2002) also reported a significant effect of farm type on manure nutrient concentrations, and similar to our data, concentrations of TKN, NH4-N, P2O5, and Mg were numerically greater for wean-to-finish compared to grow-finish farms. In contrast, Org-N, K2O, and Ca were numerically greater for grow-finish farms (DeRouchey et al. 2002).
Estimates of total nutrients produced inside and outside the Chesapeake Bay watershed
Concentrations of nutrients in manure generated on wean-to-finish and grow-finish farms located within or outside of the Chesapeake Bay watershed were similar (Table 4).
Table 4. Nutrient concentrations in manure generated on wean-to-finish and grow-finish swine farms (inventory or sales of 1,000 head or more) located within or outside of the Chesapeake Bay watershed in Virginia from 2017 to 2020.

a,b For TKN, NH4-N, and Ca, means for various years with different superscripts differ (P < 0.05).
Using industry-supplied data for pig farm types, size, and locations (table 2); pig growth and manure production (table 1); and manure nutrient concentrations (table 3), we were able to estimate the total number of pigs produced and nutrients generated on wean-to-finish and grow-finish farms located within and outside of the Chesapeake Bay watershed. This data (table 5) slightly underestimates total nutrients generated by the swine industry because it does not include data from small independent operations or four nursery operations within the watershed and two farrow-to-wean and two nurseries outside the watershed. Nursery and farrow-to-wean farms, however, produce less manure than do wean-to-finish and grow-finish farms, so their absence from the data set probably has little impact.
Table 5. Estimates of total nutrients produced by wean-to-finish and grow-finish swine outside or within the Chesapeake Bay watershed in 2017.

Within the Virginia Chesapeake Bay watershed, 11 grow-finish farms produced the following total tonnage of various nutrients: TKN, 44; NH4-N, 32; ORG-N, 13; P2O5, 15; K2O, 94; Ca, 9; and Mg, 5. While these values are significant, they represent only 14% to 16% of the state total produced by swine. These grow-finish farms produced over 98,000 pigs, or approximately 19% of Virginia’s total. Based on census data (USDA 2017), the following numbers of hogs and pigs in the Chesapeake Bay watershed were sold from other states: 4,886,637 from 43 counties in Pennsylvania; 64,614 from 23 counties in Maryland; 56,154 from three counties in Delaware; 12,594 from 19 counties in New York; and 3,883 from 10 counties in West Virginia. The number of hogs sold in three states likely are underestimated because there were four counties with undisclosed data from Pennsylvania, three from New York, and one from West Virginia. Thus, in terms of swine production in the Chesapeake Bay watershed, Virginia is a distant second in terms of nutrient production, greatly trailing Pennsylvania but ahead of Maryland, Delaware, New York, and West Virginia.
Summary
Commercial swine farms in Virginia are widely dispersed among counties both within and outside of the Chesapeake Bay watershed. During the past four decades, the number of farms in the commonwealth selling hogs and pigs decreased by over 90%, yet the total number of hogs and pigs sold in the state decreased by only 6.2%. That the number of hogs and pigs sold remained relatively constant despite a dramatic decrease in the number of farms reflects growth in the number of large concentrated animal feeding operations. Indeed, over 94% of hogs and pigs sold are from farms marketing 1,000 or more animals annually. Within the Chesapeake Bay watershed in 2017, 11 large-scale grow-finish farms in vertically integrated production systems operated in seven counties and one independent city. These farms produced approximately 98,000 slaughter hogs, or 19% of the state’s total, and the following total tonnage of various nutrients: TKN, 44; NH4-N, 32; ORG-N, 13; P2O5, 15; K2O, 94; Ca, 9; and Mg, 5. While these values are significant, they represent only 14% to 16% of the state total. Although we report here the amounts of nutrients produced on Virginia swine operations we do not attempt to address the amounts of nutrients actually entering the waters of the Chesapeake Bay. On any given farm, manure and agronomic management has a major influence on loss of nutrients in the bay watershed. This characterization of animal numbers and manure nutrient generation for segments of the commercial swine industry in Virginia can help to begin building a database to facilitate creating mathematical models that various groups, such as the Chesapeake Bay Foundation, can use as decision-making tools.
References
Beegle, D. 2013. “Nutrient Management and the Chesapeake Bay.” Journal of Contemporary Water Research and Education 151:3-8.
Brumm, M. 2010. Water Recommendations and Systems for Swine. U.S. Pork Center of Excellence. National Swine Nutrition Guide. Pork Information Gateway PIG 07-02-08.
DeRouchey, J. M., R. D. Goodband, J. L. Nelssen, M.
D. Tokach, S. S. Dritz, and J. P. Murphy. 2002. “Nutrient Composition of Kansas Swine Lagoons and Hoop Barn Manure.” Journal of Animal Science 80:2051-61.
Estienne, M., R. Meinen, J. Kristoff, T. Sexton, B. Long, and M. Dubin. 2016. “Recommendations To Estimate Swine Nutrient Generation in the Phase 6 Chesapeake Bay Program Watershed Model.” Chesapeake Bay Program.
https://www.chesapeakebay.net/documents/Swine_Characterization_Study_Final_Report.pdf.
Honeyman, M. S., R. S. Pirog, G. H. Huber, P. J. Lammers, and J. R. Hermann. 2006. “The United States Pork Niche Market Phenomenon.” Journal of Animal Science 84:2269-75.
https://doi.org/10.2527/jas.2005-680.
Kaufman, Z., D. Abler, J. Shortle, J. Harper, J. Hamlett, and P. Feather. 2014. “Agricultural Costs of the Chesapeake Bay Total Maximum Daily Load.” Environmental Science and Technology 48:14131-38.
Keisman, J. L. D., O. H. Devereux, A. E. LaMotte, A. J. Sekellick, and J. D. Blomquist. 2018. Manure and Fertilizer Inputs to Land in the Chesapeake Bay Watershed, 1950–2012. Reston, VA: U.S. Geological Survey Scientific Investigations Report 2018-5022.
https://doi.org/10.3133/sir20185022.
Montefiore, L. R., N. G. Nelson, A. Dean, and S. Mahmoud, 2022. “Reconstructing the Historical Expansion of Industrial Swine Production from Landsat Imagery.” Scientific Reports 12:1736. https://doi.org/10.1038/s41598-022-05789-5.
National Marine Fisheries Service. 2018. Fisheries Economics of the United States, 2016. U.S. Department of Commerce, National Oceanic and Atmospheric Administration Technical Memo NMFS-F/SPO-187a.
Peters, J., S. M. Combs, B. Hoskins, J. Jarman, J. L. Kovar, M. E. Watson, A. M. Wolf, and N. Wolf. 2003. Recommended Methods of Manure Analysis. University of Wisconsin-Extension Cooperative Extension Publishing A3769.
Pomar, C., I. Andretta, and A. Remus. 2021. “Feeding Strategies to Reduce Nutrient Losses and Improve the Sustainability of Growing Pigs.” Frontiers in Veterinary Science 8:74220.
https://www.ncbi.nlm.nih.gov/pmc/articles/PMC8581561/pdf/fvets-08-742220.pdf.
Smith, B. C., D. S. Andersen, J. D. Harmon, and J.P. Stinn. 2017. “Case Study of Swine Finishing Manure Nutrient Characteristics for Land Application.” American Society of Agricultural and Biological Engineers Annual International Meeting, Paper No. 1700205, Spokane, WA, July 2017. https://doi:10.13031/aim.201700205.
U.S. Department of Agriculture National Agricultural Statistics Service. “Census of Agriculture.” Last modified November 23, 2022. https://www.nass.usda.gov/AgCensus/
U.S. Environmental Protection Agency Chesapeake Bay Program. n.d. “Agricultural Runoff.” Learn the Issues. Threats to the Bay. Accessed December 27, 2022.
https://www.chesapeakebay.net/issues/threats-to-the-bay/agricultural-runoff.
Acknowledgments
The author appreciates project support provided by the U.S. Environmental Protection Agency and the Virginia Pork Council Inc., as well as technical assistance provided by Mark Dubin, Chesapeake Bay Program; Tim Sexton, Bobby Long, and Seth Mullins, Virginia Department of Conservation and Recreation; and R.O. Britt and Jeremy Pittman, Smithfield Hog Production Division.
Virginia Cooperative Extension materials are available for public use, reprint, or citation without further permission, provided the use includes credit to the author and to Virginia Cooperative Extension, Virginia Tech, and Virginia State University.
Virginia Cooperative Extension is a partnership of Virginia Tech, Virginia State University, the U.S. Department of Agriculture (USDA), and local governments, and is an equal opportunity employer. For the full non-discrimination statement, please visit ext.vt.edu/accessibility.
Publication Date
February 14, 2023