Aerial Spectral Imagery to Determine Wheat Fertility Rate and Timing
ID
SPES-582NP
Introduction
Early leaf and tiller development in wheat is crucial since the number of tillers per plant is a critical yield component (Friend et al., 1962; Klepper et al., 1982; Thiry et al., 2002). Fall tillers can contribute up to 87% of grain yield (Tilley et al., 2019); therefore, if tiller densities are not sufficient at Zadok’s Growth Stage 25 (GS 25) in late January/early February, then nitrogen (N) should be applied to optimize and stimulate tiller growth. If tiller density is less than 50 tillers per square foot at GS 25, then a N application is recommended. However, if tiller density is greater than 50 tillers per square foot, no nitrogen should be applied until GS 30 (Alley et al., 2019). Although manually counting tillers to determine tiller density is an effective method in determine N need, the use of aerial spectral indices to determine tiller density is now available.
Using Spectral Indices as a Proxy for Tiller Density
Normalized difference vegetative index (NDVI) is a spectral index that utilizes the near infrared band of the spectrum to assess crop reflectance. In the near-infrared (NIR) spectrum, reflectance of a green healthy plant is higher than a nutrient stressed or dead plant (Chandel, 2023).
Research conducted at Virginia Tech from 2018-2023 examined the relationship between tiller density and NDVI. This research used small plots to determine the relationships and build a model between NDVI and tiler density.
Large on-farm strip trials were then used to validate the model and confirm that aerial NDVI is an excellent proxy for tiller density in wheat (Oakes et al., 2024). From this research, a model was developed to calculate tiller density from aerial NDVI:
Tiller Count = 0.00071NDVIa + 0.26231
1US Provisional Patent Application Serial No. 63/601,588
where NDVIa is aerial NDVI extracted from aerial multispectral images at an altitude of 164 feet collected with a MicaSense RedEdge Sensor. Using this equation, we can determine wheat N needs based on aerial NDVI, instead of having to manually count tillers. For instance, an aerial NDVI of 0.62 corresponds to 50 tillers per square foot (table 1). Therefore, if aerial NDVI values are greater than 0.62, a N application is not needed (at GS 25). Table 1 breaks down the N rate needed when using aerial NDVI instead of tiller density (Lee & Oakes, 2023; Oakes et al., 2024).
| Tillers per sq. ft. | lbs. N per acre | NDVI | lbs. N per acre |
|---|---|---|---|
| 50+ | No N | 0.62+ | No N |
| 40-49 | 40 | 0.55-0.61 | 40 |
| 30-39 | 50 | 0.48-0.54 | 50 |
| 20-29 | 60 | 0.40-0.47 | 60 |
Tools Needed
A few pieces of technology are needed to correctly use aerial NDVI to determine N need in wheat. The most important is a multispectral camera with NIR and red bands (Figure 1).
These bands enable the user to extract NDVI [(NIR-Red)/(NIR+Red)] from the images. The multispectral camera must be mounted on a suitable drone or UAV that has the payload to carry and is able to correctly collect the images.

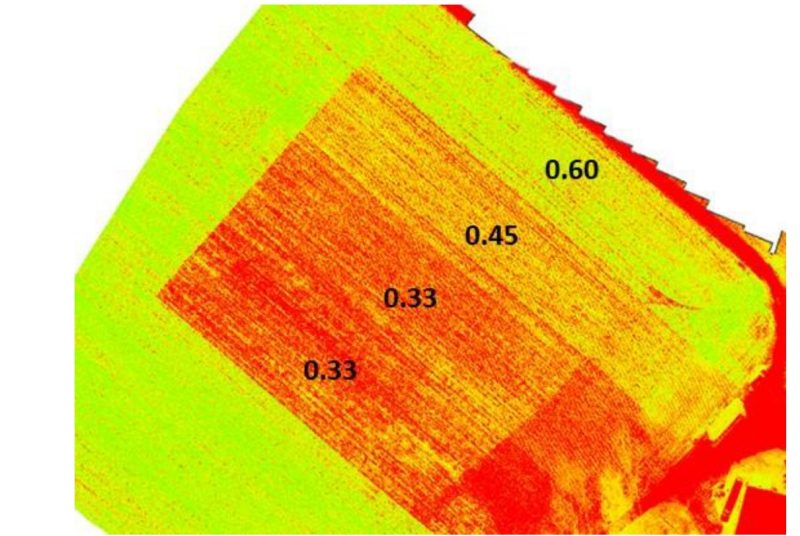
After the flight images must be merged, analyzed, and NDVI extracted into an NDVI map (Figure 2). There are many types of multispectral image management software that can perform this.
Making Management Decisions
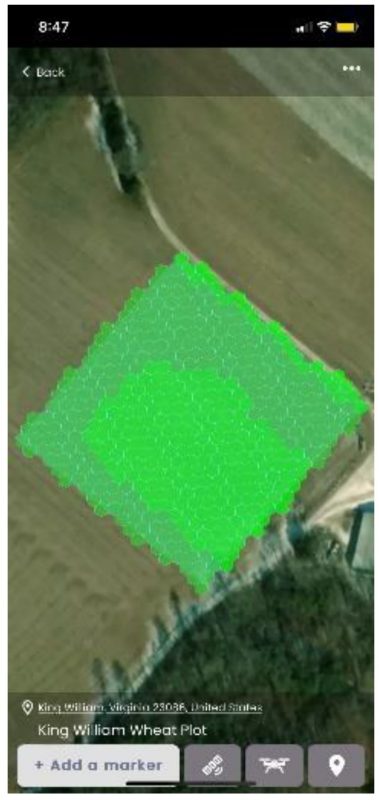
Using aerial NDVI as a proxy for tiller density is a quick and accurate method to determine N need in a wheat field. The collected images can be turned into NDVI prescription maps that can be converted into GIS-based shapefiles and transferred into a GPS-equipped sprayer, which can apply the N at variable rates across the field based on the NDVI. A grower without a GPS- equipped sprayer can still use this tool to get an overall idea of average tiller density in a field and apply N accordingly. The increasing accuracy of satellite-based aerial NDVI is also a possibility to achieve a NDVI-based prescription map (Figure 3). Research is currently on-going that compares satellite-based and drone-based NDVI; however, differences are minimal.
Ultimately, aerial NDVI is an excellent proxy for tiller density that enables growers to determine tiller density and N requirements at GS 25 without having to manually count tillers. This is a powerful tool that growers can utilize to save on time and fertility costs.
References
Alley, M.M.; Scharf, P.; Braun, D.E.; Baethgen, W.E.; Hammons, J.L. Nitrogen Management for Winter Wheat: Principles & Recommendations; Pub. No. 424-026; Virginia Cooperative Extension: Blacksburg, VA, 2009.
Chandel, A. Aerial imagery to improve disease diagnosis and management in field crops; Pub. No. SPES-515NP; Virginia Cooperative Extension: Blacksburg, VA, 2023.
Friend, D.J.C.; Helson, V.A.; Fisher, J.E. Leaf growth in Marquis wheat as regulated by temperature light intensity and daylength. Can. J. Bot. 1962, 40, 1299-1311.
Klepper, B.; Rickman, R.W.; Peterson, C.M. Quantitative Characterization of Vegetative Development in Small Grains. Agron. J. 1982, 5,789-792.
Lee, M.; Oakes, J. Effective tiller management for winter wheat; Pub. No. SPES-431P; Virginia Cooperative Extension: Blacksburg, VA, 2023
Oakes, J.; Balota, M.; Cazenave, A.-B.; Thomason, W. Using aerial spectral indices to determine fertility rate and timing in winter wheat. Agriculture. 2024, 14, 95. https://doi.org/10.3390/agriculture14010095.
Thiry, D.E.; Sears, R.G.; Shroyer, J.P.; Paulsen, G.M. Planting date effects on tiller development and productivity of wheat. Kansas Agric. Exp. Stn. Res. Rep. 2002, 96.
Tilley, M.S.; Heiniger, R.W.; Crozier, C.R. Tiller initiation and its effects on yield and yield components in winter wheat. Agron. J. 2019, 111, 323-332.
Virginia Cooperative Extension materials are available for public use, reprint, or citation without further permission, provided the use includes credit to the author and to Virginia Cooperative Extension, Virginia Tech, and Virginia State University.
Virginia Cooperative Extension is a partnership of Virginia Tech, Virginia State University, the U.S. Department of Agriculture (USDA), and local governments, and is an equal opportunity employer. For the full non-discrimination statement, please visit ext.vt.edu/accessibility.
Publication Date
February 22, 2024