Effective Tiller Management for Winter Wheat
ID
SPES-431P
 EXPERT REVIEWED
Introduction
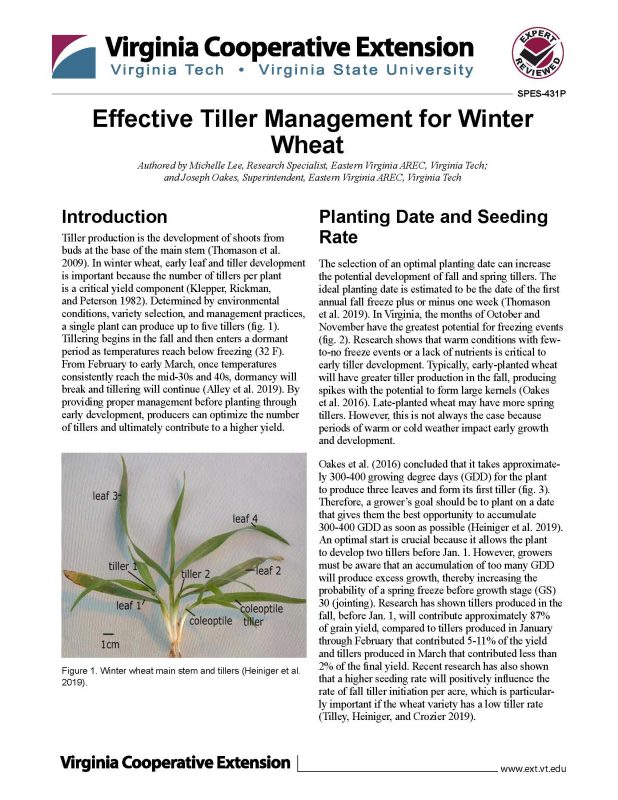
Tiller production is the development of shoots from buds at the base of the main stem (Thomason et al. 2009). In winter wheat, early leaf and tiller development is important because the number of tillers per plant is a critical yield component (Klepper, Rickman, and Peterson 1982). Determined by environmental conditions, variety selection, and management practices, a single plant can produce up to five tillers (fig. 1). Tillering begins in the fall and then enters a dormant period as temperatures reach below freezing (32 F). From February to early March, once temperatures consistently reach the mid-30s and 40s, dormancy will break and tillering will continue (Alley et al. 2019). By providing proper management before planting through early development, producers can optimize the number of tillers and ultimately contribute to a higher yield.
Planting Date and Seeding Rate
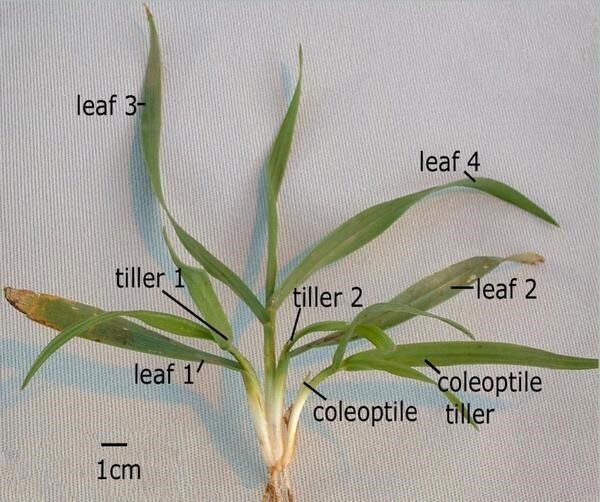
The selection of an optimal planting date can increase the potential development of fall and spring tillers. The ideal planting date is estimated to be the date of the first annual fall freeze plus or minus one week (Thomason et al. 2019). In Virginia, the months of October and November have the greatest potential for freezing events (fig. 2). Research shows that warm conditions with few-to-no freeze events or a lack of nutrients is critical to early tiller development. Typically, early-planted wheat will have greater tiller production in the fall, producing spikes with the potential to form large kernels (Oakes et al. 2016). Late-planted wheat may have more spring tillers. However, this is not always the case because periods of warm or cold weather impact early growth and development.
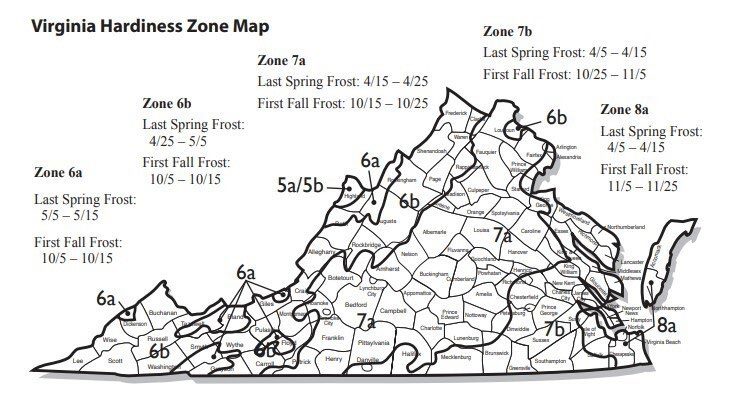
Oakes et al. (2016) concluded that it takes approximately 300-400 growing degree days (GDD) for the plant to produce three leaves and form its first tiller (fig. 3). Therefore, a grower’s goal should be to plant on a date that gives them the best opportunity to accumulate 300-400 GDD as soon as possible (Heiniger et al. 2019). An optimal start is crucial because it allows the plant to develop two tillers before Jan. 1. However, growers must be aware that an accumulation of too many GDD will produce excess growth, thereby increasing the probability of a spring freeze before growth stage (GS) 30 (jointing). Research has shown tillers produced in the fall, before Jan. 1, will contribute approximately 87% of grain yield, compared to tillers produced in January through February that contributed 5-11% of the yield and tillers produced in March that contributed less than 2% of the final yield. Recent research has also shown that a higher seeding rate will positively influence the rate of fall tiller initiation per acre, which is particularly important if the wheat variety has a low tiller rate (Tilley, Heiniger, and Crozier 2019).
Nutrient Management
Nitrogen (N) along with sufficient levels of sulfur (S) are essential nutrients for the production of winter wheat (Dhillon et al. 2019). Because S is an important component of all proteins, it is required together with N for protein synthesis (Waypoint Analytical 2020). Nitrogen is needed in a moderate amount in the fall to establish the crop and promote the production of fall tillers (Alley et al. 2019). Further N applications will be dependent on the number of tillers present at critical growth stages. Phosphorous (P) is also crucial during tiller development because it is known to affect the amount and survival of wheat tillers (Rodríguez, Andrade, and Goudriaan 1999). Furthermore, compared to any other growth stage, the greatest amount of daily potassium (K) uptake occurs between the beginning and end of tillering because it is needed to maintain cell turgidity and nutrient mobility in the plant (Waypoint Analytical 2020). It is important to perform soil testing before winter wheat planting so that nutrient adjustments can be made. Tissue sampling may be needed to ensure sufficient nutrient levels are met.
Application Timing
A pre-plant fertilizer in the fall is recommended to promote emergence, initial tillering, and root growth. This is especially true if soil nitrate levels are below 10 parts per million (ppm) NO3-N in the top 6 inches of the soil profile. However, this is not recommended if nitrate levels are at or above 30 ppm NO3-N (Alley et al. 2019). This can be determined by soil nitrate testing, an additional test that can be added to a soil testing package (Waypoint Analytical 2022). If pre-plant fertilizer is needed, only a moderate amount of nitrogen (15-30 lbs./ acre) is necessary to promote tillering and reduce the possibility of nitrogen loss by leaching during dormancy (Alley et al. 2019).
Nitrogen applications should be taken into consideration again once the crop breaks dormancy and resumes active growth. In Virginia, this occurs around late February and is categorized as growth stage 25. These applications can be a single application or a split application, and they rely heavily on tiller density. If tiller density is less than 50 tillers per square foot, a nitrogen application is recommended at GS 25 and at GS 30 for the crop to achieve optimum yield.
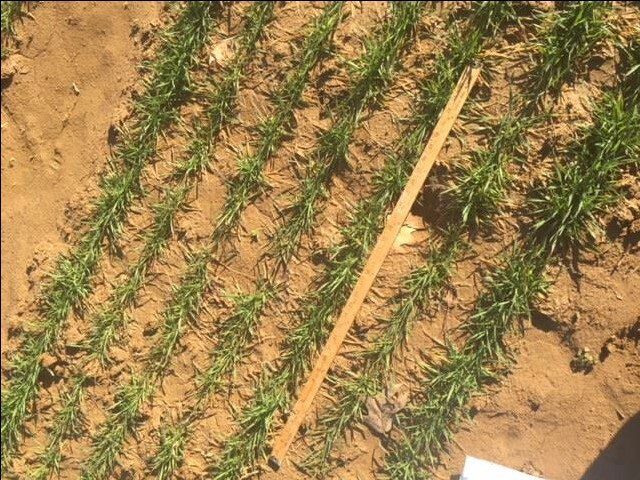
However, if tiller density is greater than 50 tillers per square foot, no nitrogen application is necessary until GS 30 (Alley et al. 2019). To get an accurate measurement of tiller density across a field, it is recommended to take a minimum of five individual tiller counts per field location. For each measurement, lay a yardstick (or measuring tape set to 3 feet) down next to a row of plants (fig. 4), count all tillers within these dimensions, and record the result. Next, average the counts together from all locations and use this formula to calculate tiller density:
Tiller density =
average tiller count x 4
__________________________
row width (in inches)
If the crop is well-tillered and has 50-100 tillers per square foot, nitrogen should not be applied until GS 30. However, if the crop has fewer than 50 tillers, an application of 40-60 pounds of nitrogen per acre is needed to stimulate further tiller development (Weisz and Heiniger 2013).
Although manually counting tillers is an effective method in determining the need for nitrogen, alternative methods of determining tiller density are now available. Ongoing research in Virginia is establishing a relationship between aerial indices by drone (unmanned aerial
vehicle or UAV) and tiller density to determine precise nitrogen rates and application timings. Research shows that normalized difference vegetative index (NDVI) is an excellent proxy for tiller density. Both ground NDVI collected with the handheld GreenSeeker crop sensor and aerial NDVI collected with a UAV can be used instead of tiller density to determine nitrogen needs. For instance, an aerial NDVI of 0.62 corresponds to 50 tillers per square foot (table 1). Therefore, if your aerial NDVI values are less than 0.62, a nitrogen application is needed at GS 25.
| Tiller density (No. tillers) |
Tiller density (Lbs.) |
Ground NDVI (NDVI) |
Ground NDVI (NDVI) |
Aerial NDVI (NDVI) |
Aerial NDVI (Lbs.) |
|---|---|---|---|---|---|
| 50+ tillers | No N | 0.49+ | No N | 0.62+ | No N |
| 40-49 | 40 | 0.42-0.48 | 40 | 0.55-0.61 | 40 |
| 30-39 | 50 | 0.36-0.41 | 50 | 0.48-0.54 | 50 |
| 20-29 | 60 | 0.29-0.35 | 60 | 0.40-0.47 | 60 |
Adoption of this precision agriculture technology also helps alleviate time constraints and field variability that can occur by taking tiller counts. Current research at Virginia Tech is also using this technology to develop prescription NDVI maps that can be accessed and used directly by a sprayer. Table 1 breaks down the amount of GS 25 N needed for various tiller densities and NDVI values (Oakes et al. 2020).
Conclusion
Planting date, seeding rate, nutrient availability, and application timing can have an effect on the success of tiller development. It is essential for growers to plan ahead by using soil sampling techniques to help determine if a pre-plant fertilizer application is needed and to implement tiller counts or the use of NDVI at the correct growth stages for a more precise nutrient recommendation and timely application of nitrogen. Ideal planting conditions based on forecasted weather events can encourage fall tiller production, but many environmental factors are variable and can affect the yield of a winter wheat crop. By using management techniques that can be controlled, we can optimize yield potential with the promotion of tiller initiation and establishment.
References
Alley, M. M., P. Scharf, D. E. Brann, W. E. Baethgen, and J. L. Hammons. 2019. Nitrogen Management for Winter Wheat: Principles and Recommendations. Virginia Cooperative Extension publication 424- 026.![]()
Dhillon, J., S. Dhital, T. Lynch, B. Figueiredo, P. Omara, and W. R. Raun. 2019. “In-Season Application of Nitrogen and Sulfur in Winter Wheat.” Agrosystems, Geosciences & Environment 2 (1): 1-8 180047. https://doi.org/10.2134/age2018.10.0047.
Heiniger, R., M. Tilley, J. Oakes, A. Post, and G. Wilkerson. 2019. Adaptive Wheat Management: Increasing Wheat Yield by Adjusting for Weather Conditions. NC State Extension.
Hessler, A. 2019. “Virginia’s Home Garden Vegetable Planting Guide: Recommended Planting Dates and Amounts to Plant.” Virginia Cooperative Extension publication 426-331 (SPES-170P).
Klepper, B., R. W. Rickman, and C. M. Peterson. 1982. “Quantitative Characterization of Vegetative Development in Small Cereal Grains.” Agronomy Journal. 74 (5): 789-92. https://doi.org/10.2134/agronj1982.00021962007400050005x.
Oakes, J., M. Balota, B. Cazenave, W. E. Thomason, and S. Sarkar. 2020. “The Use of Aerial Imagery to Determine Nitrogen Timing in Winter Wheat.” Abstract Presented at the 2020 ASA-CSSA-SSSA International Annual Meeting. Virtual Conference. Nov. 9-13, 2020. https://scisoc.confex.com/scisoc/2020am/prelim.cgi/Paper/131712.![]()
Oakes, J., R. Heiniger, C. Crozier, J. Murphy, and G. Wilkerson. 2016. “Phyllochron Interval and Yield Response to Planting Date and Fertility in Wheat.” Crop, Forage & Turfgrass Management 2 (1), 1-9. https://doi.org/10.2134/cftm2016.03.0026.
Rodríguez, D., F. Andrade, and J. Goudriaan. 1999. “Effects of Phosphorus Nutrition on Tiller Emergence in Wheat.” Plant and Soil 209:283-95.
https://doi.org/10.1023/A:1004690404870.
Thomason, W., M. Alley, W. Wysor, S. Phillips, and D. Parris. 2009. Using the Virginia Cooperative Extension Climate Analysis Web Tool To Better Manage and Predict Wheat Development. Virginia Cooperative Extension publication 424-004. https://vtechworks.lib.vt.edu/bitstream/handle/10919/55679/424-004.pdf?sequence=1.
Thomason, W. E., C. A. Griffey, M. M. Alley, E. L. Stromberg, D. A. Herbert, and E. S. Hagood. 2019. Growing Bread Wheat in the Mid-Atlantic Region. Virginia Cooperative Extension publication 424- 024.
Tilley, M. S., R. W. Heiniger, and C. R. Crozier. 2019. “Tiller Initiation and Its Effects on Yield and Yield Components in Winter Wheat.” Agronomy Journal 111 (3): 1323-32. https://doi.org/10.2134/agronj2018.07.0469.
Waypoint Analytical. 2020. Winter Wheat Tissue Sampling. Fact Sheet. www.waypointanalytical.com/Docs/WinterWheatTissueFactSheet.pdf.
Waypoint Analytical. 2022. “Soils & Media.” www.waypointanalytical.com/SoilsMedia.
Heiniger, R., Hicks, K., Gaitboni, L., Post, A.. 2021. “Nitrogen Management for Small Grains.” In Small Grain Production Guide. North Carolina State Extension. Small-Grain-Production-Guide-2021_ online.pdf (ncsu.edu)
Virginia Cooperative Extension materials are available for public use, reprint, or citation without further permission, provided the use includes credit to the author and to Virginia Cooperative Extension, Virginia Tech, and Virginia State University.
Virginia Cooperative Extension is a partnership of Virginia Tech, Virginia State University, the U.S. Department of Agriculture (USDA), and local governments, and is an equal opportunity employer. For the full non-discrimination statement, please visit ext.vt.edu/accessibility.
Publication Date
January 4, 2023