

Managing Phosphorus Balance on Virginia Dairy Farms
ID
SPES-278NP
Background
Virginia dairy farms can maintain milk production and improve their long-term sustainability by balancing their whole farm phosphorus imports and exports (measured here as lbs/ac P2O5). The annual phosphorus mass balance is the difference in the quantity of phosphorus imported onto the farm (such as purchased feed, fertilizer, etc.) and exported from the farm (such as crops, milk sold, etc.) during a year. If more phosphorus is imported than exported, this surplus phosphorus ends up in the soil through manure applications and can result in soil test phosphorus well above agronomic needs. Farmers can easily fix a negative phosphorus balance by purchasing phosphorus fertilizer or poultry litter, but a positive balance may be harder to address. Previous work in other states demonstrated that large positive phosphorus balances can be reduced over time through changes in farm management while still maintaining milk production (Cela et al. 2015). Our study evaluated the status of phosphorus balance on Virginia dairy farms and identified management risk factors associated with those farms that had excessive phosphorus.
Information on Participating Dairy Farms
Virginia dairy farms were invited to participate in the study through various types of contacts. In all, 58 dairy and mixed-operation dairy farms provided farm and phosphorus balance data. The phosphorus balance calculations were conducted in 2017, accounting for all phosphorus imports and exports that passed through the farm gate between Jan. 1 and Dec. 31 of that year. Farmers provided data on farm characteristics, such as acreage and animal numbers, as well as phosphorus imports and exports. Imports of phosphorus included in the calculations were feed purchased, fertilizers or animal manure and poultry litter, animals purchased, and bedding materials. Exports were milk sold, animals sold,
crops sold, and animal manure exported off-farm. More detailed information on phosphorus measurements and other aspects of the study can be found in the journal article by Pearce and Maguire (2020). The participating dairy farms had a broad range in size, animal density, and productivity (Table 1). After phosphorus balance calculations, all participating farmers were provided individualized reports that showed how they compared to the other dairy farms.
The greatest phosphorus import was through purchased feed (1 to 149 lbs/ac), followed by poultry litter generated on-farm (0.0 to 276 lbs/ac) and poultry litter imported (0.0 to 83.6 lbs/ac) (Table 2). Other imports, like bedding materials, fertilizer, dairy manure, and animal purchases, averaged less than 3 lbs/ac combined. On the other hand, phosphorus tended to leave farms primarily through milk sold, especially on dairy farms that did not generate poultry litter. Milk-phosphorus exports ranged from 4.4 to 74.1 lbs/ac based on the land base and animal densities (Table 2). Farms with poultry and more cropland exported as much as 276 lbs/ac of P2O5 in poultry litter and 54.3 lbs/ac in crop sold. The 14 dairy farms with poultry operations exported 52% of generated poultry litter, which was lower than a separate statewide assessment of 85% of generated poultry litter (Pearce and Maguire 2020). The lowest phosphorus export was through animals sold.
The median phosphorus balance of the 58 Virginia dairy farms was 25.4 lbs/ac, which was similar to phosphorus surplus (26.3 lbs/ac) on 38 Danish dairies (Nielsen and Kristensen 2005). A positive phosphorus balance results when phosphorus imports exceed phosphorus exports. This study found that 79% of the participating Virginia farms had a positive phosphorus balance (greater than 0 lbs/ac), and these farms need to keep track of soil test phosphorus to minimize the environmental and regulatory impact.
| Characteristic | Mean | Minimum | Median | Maximum |
|---|---|---|---|---|
| Mature dairy cows (n) | 122 | 30 | 108 | 360 |
| Total animal units* (AU) | 251 | 73 | 226 | 811 |
| Total land base (ac) | 320 | 52 | 215 | 1,600 |
| Manured land (%) | 69 | 7 | 74 | 100 |
| Animal density* (AU/ac) | 1.1 | 0.3 | 0.9 | 2.7 |
| Milk sold (lbs/cow/yr) | 24,500 | 6,850 | 25,100 | 34,600 |
| Milk sold (1000 lbs/ac) | 12.2 | 1.9 | 9.5 | 32.4 |
* 1 Animal Unit = 1000 lbs animal weight (includes all dairy cows plus beef, but not poultry, as poultry litter is collected and often exported)
Characteristic Imports, lbs/ac |
Mean | Minimum | Median | Maximum |
|---|---|---|---|---|
| Feed | 48.4 | 1.0 | 38.1 | 149 |
| Poultry litter, generated | 24.7 | 0.0 | 0.0 | 276 |
| Poultry litter, imported | 7.7 | 0.0 | 0.0 | 83.6 |
| Misc, bedding | 1.4 | 0.0 | 0.6 | 12.5 |
| Fertilizer | 0.8 | 0.0 | 0.0 | 21.7 |
| Dairy manure | 0.2 | 0.0 | 0.0 | 11.1 |
| Animals purchased | 0.2 | 0.0 | 0.0 | 3.2 |
| Total | 83.4 | 13.7 | 71.2 | 370 |
Characteristic Exports, lbs/ac |
Mean | Minimum | Median | Maximum |
|---|---|---|---|---|
| Milk | 28.0 | 4.4 | 21.7 | 74.1 |
| Poultry litter | 14.8 | 0.0 | 0.0 | 276 |
| Crop | 4.7 | 0.0 | 0.0 | 54.3 |
| Animals sold | 4.6 | 1.1 | 3.7 | 12.0 |
| Dairy manure | 5.1 | 0.0 | 0.0 | 55.7 |
| Total | 57.2 | 5.5 | 41.2 | 341 |
| Total P2O5 Balance, lbs/ac |
26.2 | -63.2 | 25.4 | 200 |
Defining a Zone of Operation for Phosphorus Balance and Phosphorus Use Efficiency
To establish reasonable guidelines for phosphorus balance targets, this study’s authors drew upon an approach demonstrated in the state of New York (Cela et al. 2015). An upper phosphorus mass balance was set so that 75% of dairy farms fall below that phosphorus surplus per acre, with the idea that if 75% of farms can do this, then all farms should find it achievable. Because farms should not operate long-term with negative phosphorus balances, another bounding guideline was set along the bottom of the zone at 0 lbs/ ac. Another guideline focused on phosphorus balances related to milk production, a measure of efficiency. That target was set so that 50% of dairy farms produced milk
below a certain phosphorus balance per 1,000 lbs of milk.
In Virginia, the 17 farms within the sustainable zone (shaded region in figures 1 and 2) were able to both efficiently produce milk and manage phosphorus balances. In this study, 75% of the farms operated with a phosphorus balance of less than 38.3 lbs/ac, as indicated by farms falling below the horizontal dashed line in the figures. Though more sustainable than the top 25% of farms, operating at 38.3 lbs/ac can still increase Mehlich 1 soil test phosphorus by about 2 ppm (4 lbs/ac) annually in the soils of this region (Maguire, Mullins, and Brosius 2008). Farms like the one marked in figure 1 as “H” (200 lbs/ac) should drastically reduce phosphorus imports or increase phosphorus exports, and farms with a negative phosphorus balance, like the one marked as “L” (-21 lbs/ac), should monitor soil test phosphorus to avoid limiting yields in the long run. The average phosphorus use efficiency of Virginia dairy farms was 2.2 lbs of surplus phosphorus per 1,000 lbs-milk (figure 1). As there was no correlation between farm phosphorus balance and milk production, farms can improve phosphorus use efficiency without affecting milk production. phosphorus to avoid limiting yields in the long run.
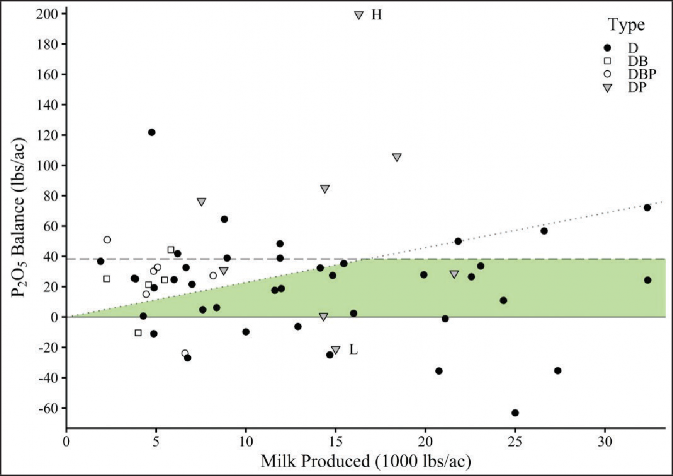
When looking at farm type, the eight mixed-operation dairy and poultry farms (DP) had the greatest median phosphorus balance of 53.6 lbs/ac followed by the six mixed-operation dairy, poultry, and beef farms (DBP) with a median phosphorus balance of 28.8 lbs/ac. The mean phosphorus balance for all farms was 25.4 lbs/ac (Figure 1).
Dairy farms with poultry (DP and DBP) falling above the feasible operation zone did not export poultry litter. Farms can export excess poultry litter to reduce phosphorus imports.
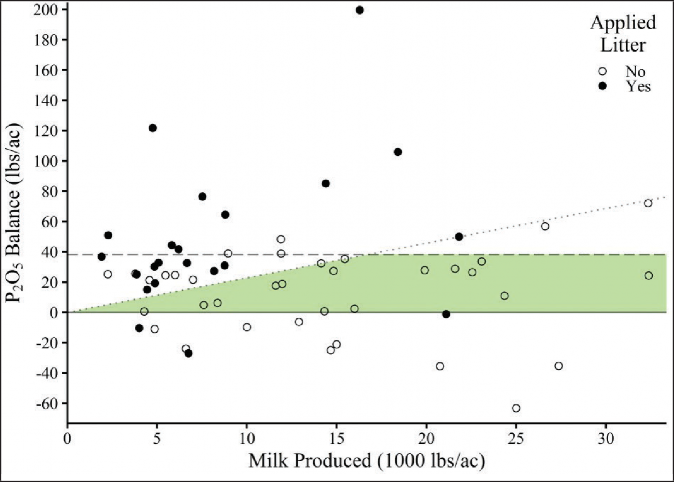
Overall, 22 out of the 58 farms applied poultry litter and had a mean phosphorus balance of 47.8 lbs/ac, which was well above the median phosphorus balance of 25.4 lbs/ac for all of the farms in the study (Figure 2). Of the 11 farms with the highest farm phosphorus balance and below-average milk production, nine applied poultry litter. Some farms were able to use poultry litter without having an excessive phosphorus balance, but these tended to have more cropland and were able to grow more of their own feed and therefore import less phosphorus in feed. The high phosphorus content in poultry litter makes it the largest risk factor for phosphorus imbalance in this study. Other factors, like animal density and use of dried distiller’s grains (DDGs), were not direct risk factors for Virginia dairy farms.
Conclusions on Phosphorus Management on a Farm
There was no direct link between phosphorus balance and milk production, and therefore, some Virginia dairy farmers efficiently balanced phosphorus without affecting the production of milk. Farms that fall outside the feasible zone of operation can improve phosphorus balance by changing management practices with the help of the indicators in Table 2. There were two clear risk factors for surplus phosphorus balance: 1) excess use of poultry litter, and 2) excess phosphorus imported in purchased feed. While poultry litter is a good fertilizer in many situations, excess phosphorus balances can be minimized by avoiding regular use of poultry litter and exporting generated poultry litter from mixed dairy and poultry farms. Likewise, farmers with a phosphorus deficit could assist by importing poultry litter from local farms with excess phosphorus. It is also important to optimize homegrown feed production and follow precision feeding practices with purchased feeds. Overall, farms can increase their phosphorus use efficiency for long-term sustainability while maintaining milk production by minimizing risk factors associated with increasing soil test phosphorus concentrations.
References
Cela, S., Q. Ketterings, M. Soberon, C. Rasmussen, and K. Czymmek. 2015. Agronomy Fact Sheet 85: Feasible Whole-Farm Nutrient Mass Balances. Cornell University Cooperative Extension, Ithaca, NY. http://nmsp.cals.cornell.edu/publications/ factsheets/factsheet85.pdf.
Maguire, R.O., G.L. Mullins, and M. Brosius. 2008. “Evaluating Long Term Nitrogen versus Phosphorus Based Nutrient Management of Poultry Litter.” Journal of Environmental Quality 37:1810-1816.
Nielsen, A. H., and I. S. Kristensen. 2005. “Nitrogen and Phosphorus Surpluses on Danish Dairy and Pig Farms in Relation to Farm Characteristics.” Livestock Production Science 96:97-107.
Pearce, A.W., and R.O. Maguire. 2020. “The State of Phosphorus Balance on 58 Virginia Dairy Farms.” Journal of Environmental Quality 49: 324–334.
Virginia Cooperative Extension materials are available for public use, reprint, or citation without further permission, provided the use includes credit to the author and to Virginia Cooperative Extension, Virginia Tech, and Virginia State University.
Virginia Cooperative Extension is a partnership of Virginia Tech, Virginia State University, the U.S. Department of Agriculture (USDA), and local governments, and is an equal opportunity employer. For the full non-discrimination statement, please visit ext.vt.edu/accessibility.
Publication Date
March 15, 2021
