Managing Drainage From Agricultural Lands with Denitrifying Bioreactors in the Mid-Atlantic
ID
BSE-234P (BSE-355P)
 EXPERT REVIEWED
This publication highlights opportunities and challenges for adapting denitrifying bioreactors* to treat agricultural drainage water in the Coastal Plain region of the Mid-Atlantic and describes the outlook for reducing nitrogen loss from agricultural land with these practices.
Opportunities
Artificial drainage of agricultural land is essential to the productivity of otherwise poorly drained soils. However, artificial drainage is associated with increased nutrient (nitrogen and phosphorus) loss from agricultural land and resultant water quality problems. Reducing the environmental impact of agriculture starts in the field.
Examples of in-field nutrient management include proper design of drainage systems and nutrient management plans that follow the “4R” approach: the Right fertilizer source is applied at the Right rate, at the Right time, and in the Right place (4R Nutrient Stewardship 2023). However, crops cannot use fertilizer with perfect efficiency, and a portion will be lost to the environment. Edge-of-field best management practices (BMPs) can be used to remove nutrients from drainage water as it leaves the field and before it enters surface water bodies. These practices include vegetated stream buffers (see Virginia Cooperative Extension publication BSE-38NP), constructed wetlands, drainage water management (BSE-54P), and denitrifying bioreactors (BSE-55P).
Denitrifying bioreactors are essentially trenches or beds containing organic carbon material typically woodchips. These structures intercept agricultural drainage or shallow groundwater containing excess bioavailable nitrogen in the form of nitrate (NO3-), which is associated with water quality problems. When bioreactors are filled with nitrate-enriched drainage water, the woodchips support the activity of soil bacteria that convert the nitrate into the inert nitrogen gas (N2) that makes up nearly 80% of the atmosphere. Denitrifying bioreactors typically remove 35-50% of the nitrate in drainage waters and do not have adverse effects on crop production or restrict drainage. Through work mostly conducted in the Midwest, largely focused on treatment of subsurface or “tile” drainage, bioreactors have moved beyond proof-of-concept in the last several years. The U.S. Department of Agriculture Natural Resources Conservation Service has published “Conservation Practice Standard 605” for denitrifying bioreactors to treat tile drainage (USDA-NRCS 2020).
As bioreactors are increasingly and successfully used in the Midwest, interest in their application is growing in the Mid-Atlantic, also an agriculturally significant region. Though a relatively smaller extent of farmland is artificially drained in the Mid-Atlantic (see fig. 1), agricultural drainage is a significant source of nutrients to the Chesapeake Bay and is important to manage.
Additionally, increased climate variability associated with climate change (see BSE-109P) is likely to result in soils being more frequently waterlogged, which can drive an increase in artificial drainage to maintain resilient agricultural systems in this region. Work is underway to adapt the traditional tile drain bioreactor design described by NRCS Standard 605 (USDA-NRCS 2020) to agricultural drainage systems typical of the Mid-Atlantic. Design and performance data for nine denitrifying bioreactors tested in the Coastal Plain region of Maryland and Virginia are presented in table 1.
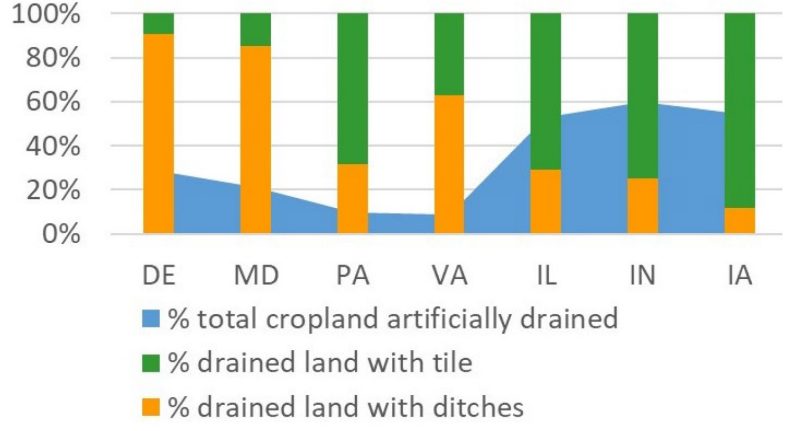
Table 1 documents the amount of nitrate removed by the bioreactors as both a concentration reduction and a load reduction. The concentration reduction is simply the difference between the nitrate concentration entering and exiting the bioreactor expressed as a percentage. It is not dependent on the total amount of water flowing through the bioreactor. In contrast, the load reduction refers to the amount of nitrate removed as a percentage of the total amount of nitrate present in the agricultural drainage. Load reduction differs from concentration reduction when some fraction of the drainage water bypasses the bioreactor.
Bypass flow occurs by design in some bioreactors following rainstorms that result in more drainage flow than the bioreactor can effectively treat. By diverting some of the flow, the portion of the drainage that is treated moves slowly enough through the bioreactor that the nitrate can be removed. Attempting to treat higher flows than a bioreactor of a given size is designed for would result in unsatisfactorily low nitrate reductions, which is discussed below. Consequently, the difference between concentration and load reduction is important because reducing the nitrate load that leaves the field and enters downstream water bodies ultimately results in an environmental benefit. Considering the concentration reduction without considering bypass flow would overestimate the overall impact of the bioreactor. As shown in table 1, the load reductions observed in the Mid-Atlantic bioreactors range from 10% to 55%, but concentration reductions were up to 98%.
Another consideration is the tradeoff between the volume of water a bioreactor can treat and the efficiency with which it can remove nitrate. Higher concentration reduction can be maintained under lower flows when the water can spend more time in the bioreactor and undergo more treatment. Under higher flows more water can be treated but the concentration reduction is usually smaller. Treating more water often results in greater load reductions despite lower concentration reductions. Balancing treatment volume and treatment efficiency is an important operational consideration to accurately determine the environmental benefit.
While bioreactor performance is site-specific and variable, several factors that affect bioreactor design and performance could account for the slightly lower load reductions in these Mid-Atlantic bioreactors than their Midwestern counterparts. These factors and their implications for adapting bioreactor design to Mid- Atlantic agricultural systems are presented as follows.
| # | Type | Carbon media |
Area drained (acres) |
Dimensions (length x width x depth;feet) |
Average nitrate removal % conc. |
Average nitrate removal % load |
Average nitrate removal g m-3 d-1 |
Bypass flow (%) |
|---|---|---|---|---|---|---|---|---|
| 1 | Tile | WC | 62 | 85 x 15 x 2.6 | 98 | 55 | 5.2 | 46 |
| 2 | Tile | WC | 16 | 19 x 17 x 2.6 | 16 | 9.5 | 0.6 | 0 |
| 3 | Tile | WC | 99 | 100 x 30 x 3 | 10 | 10 | 1.5 | 2 |
| 4 | Ditch diversion | WC |
86 | 100 x 20 x 3 | 98 | 13 | 0.3 | 83 |
| 5 | Ditch diversion | WC | 86 | 115 x 26 x 3 | 75 | 25 | 1.0 | 67 |
| 6 | Wall | WC | 12 | 45 x 6 x 6 | 60 | * | * | — |
| 7 | Wall | WC + 10% biochar | 12 | 45 x 6 x 6 | 60 | * | * | — |
| 8 | Wall | Sawdust | 0.2 | 72 x 2 x 5 | >90 | * | 2.4 | — |
| 9 | In-ditch | WC | 16 | Three in-line 88- 125 x 3.6 x 2.3 sections |
65 | * | * | — |
* Not reported
Challenges
Denitrifying bioreactors hold promise for managing agricultural drainage in the Mid-Atlantic, but challenges remain with respect to adapting designs developed in the Midwest. Large subsurface (tile) drainage networks are typical of the Midwest, while open ditches and smaller tile drainage systems are typical of the Mid- Atlantic region. Since the NRCS bioreactor design standards (e.g., NRCS Practice Standard 605) were developed for lined woodchip beds used in conjunction with tile drainage, the suitability of these standards for bioreactors used in conjunction with surface drainage requires investigation.
Agricultural systems in the Mid-Atlantic are differentiated from those in the Midwest by the dominance of surface (ditch) drainage (fig. 1), relatively smaller drainage networks, and shallow water tables characterizing much of Mid-Atlantic agriculture.
Even though both the Midwest and Mid-Atlantic have relatively flat landscapes with low slopes, the smaller drainage areas of the Mid-Atlantic mean there is a smaller elevation difference (head) across a field. Lower head is a design challenge because it results in a smaller force moving water through the bioreactor, which limits how much and how quickly water reaches the bioreactor. Lower flows result in longer residence times within bioreactors, and nitrate concentration reductions are typically greater. However, with lower flows a smaller total volume of water passes through the bioreactor. Consequently, the nitrate load reduction can be constrained by these low flows.
Ultimately, the amount of water that can be treated depends on the size of the bioreactor. Shallow water tables typical of the Coastal Plain can constrain the maximum depth for bioreactors. Because the length and width of the bioreactor are often limited by the space available without taking land out of production, the water table depth becomes an important limit for bed size and, in turn, the volume of water that can be treated effectively.
To overcome these design challenges, three bioreactor designs have been tested for use in ditch systems: the ditch diversion bioreactor, sawdust wall, and in-ditch bioreactor (fig. 2). The ditch diversion bioreactor (fig. 2a; table 1, numbers 4 and 5) is the most straightforward adaptation of tile drain bioreactors because the same design guidelines are used to design the bed; water is diverted from the ditch with a drainage control structure and routed through a bioreactor, and treated water is returned to the ditch. The ditch diversion bioreactors achieved moderate nitrate load reduction (9-25%) and very efficient concentration reductions (75-98%). However, the lower load reduction rates were likely attributable to undersized beds resulting in more bypass flow (63-87%), and greater load reduction could be expected from larger beds.
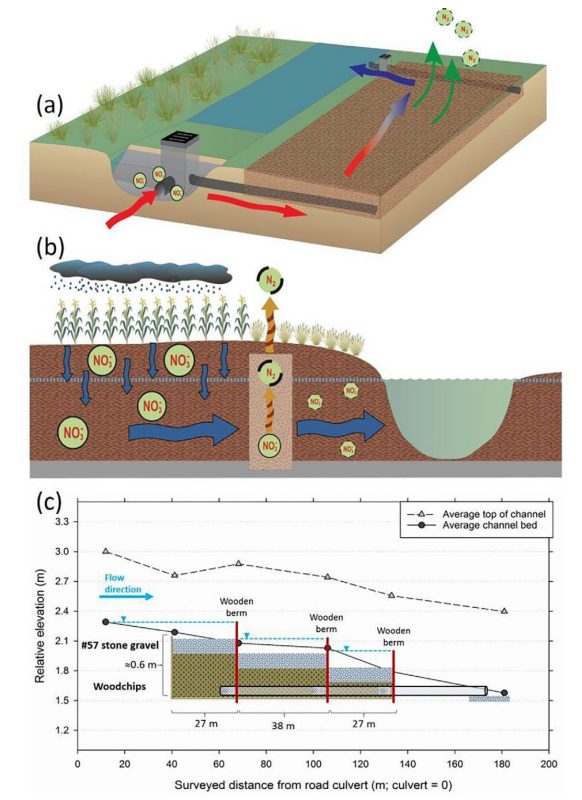
The denitrifying walls (fig. 2b; table 1, numbers 6-8) are unlined trenches filled with wood-based material. The sawdust wall (table 1, number 6) runs parallel to a drainage ditch and is filled with a mixture of sawdust and native soil that intercepts shallow groundwater as it leaves the field. The sawdust wall removed more than 90% of the nitrate passing through it, but load reductions could not be estimated due to the difficulty in quantifying the flow of water through the wall.
A two-compartment denitrification wall installed at the Eastern Shore Agricultural Research and Extension Center (see BSE-55P) compared the performance of woodchips (table 1, number 7) and woodchips with added biochar (table 1, number 8), a form of organic carbon similar to charcoal. Both compartments reduced the nitrate concentration by an average of 60% and up to 90%, showing little effect of biochar on nitrate removal, but, again, load reductions were not reported. Better estimates of the flow of water and nitrate through denitrification walls will be needed to assess their utility in terms of load reductions. Though unlined denitrifying walls are much simpler to design and build than tile- fed or ditch-diversion bioreactors that utilize drainage control structures and impermeable liners, walls typically remove nitrate about 10 times more slowly than denitrifying beds.
The in-ditch bioreactor (fig. 2c; table 1, number 9) consists of a layer of woodchips covered by a layer of gravel installed in an excavated area of ditch bed. This is the most experimental among the ditch bioreactor designs, and it required a more complex engineering design and installation process than the ditch-diversion or wall-type bioreactors. Measuring flow through the in-ditch bioreactor was a barrier to calculating nitrate load reduction. However, the 65% nitrate concentration reduction is only slightly lower than that observed for the ditch-diversion bioreactors and indicates promise for the design. Before in-ditch bioreactors can be viable options for nitrate removal, problems with sedimentation and clogging identified in the experimental system must be addressed with ditch bank stabilization practices and additional testing.
Use of denitrifying bioreactors with tile drainage systems, the more typical application widely used in the Midwest, has also been studied in the Mid-Atlantic Coastal Plain. Of the three tile-fed bioreactors monitored (table 1, numbers 1-3), nitrate load reductions ranged from 10% to 55%, and concentration reductions ranged from 10% to 98%. One bioreactor monitored by Virginia Tech illustrates several potential reasons why some nitrate load reductions are lower than those typical of Midwest bioreactors (~35-50%). This 130 yd3 bioreactor filled with 90% woodchips and 10% biochar was installed on the Virginia Coastal Plain in 2014 and monitored for two years (table 1, number 2). The bioreactor removed about 10% of the nitrate load — less than the target of 30% set by the NRCS Conservation Practice Standard. Site constraints likely limited nitrate removal, specifically low influent nitrate concentrations (4.4 mg/L on average) and a low influent pH (5.3 on average). Both low nitrate concentrations and pH are known to limit the activity of denitrifying organisms.
Lower nitrate loading from relatively smaller tile drainage networks and lower the pH characteristic of Coastal Plain soils are likely to be more prevalent in the Mid-Atlantic than in the Midwest, where denitrifying bioreactor performance estimates were developed. Therefore, determining regionally specific performance expectations and design or operational measures to overcome the limitations imposed by these site conditions is important. Work continues in order to assess how bioreactors can be used effectively to meet Chesapeake Bay water quality improvement goals. Bioreactor nitrate-removal efficiency and cost- effectiveness vary and depend on appropriate, site- specific designs.
Outlook
Adapting the traditional tile drain bioreactor design to ditch drainage networks, overcoming shallow water tables and low gradients, and more effectively treating low nitrate loads in small tile drain systems have the potential to yield substantial water quality benefits in the Chesapeake Bay watershed where surface drainage of agricultural land predominates. Ditch diversion bioreactors appear to achieve nitrate load reductions similar to tile-fed bioreactors in studies in the Mid- Atlantic Coastal Plain (table 1). These results indicate the potential for bioreactors to improve water quality in the Chesapeake Bay watershed. However, research in other physiographic regions (e.g., Piedmont and Ridge and Valley) is needed to confirm the transferability of the technology.
With respect to overcoming the site limitations of shallow water tables and low nitrate loads, targeting sites where bioreactors can remove the most nitrate could prove to be more important than design adjustments.
Optimal sites would be those with larger nitrogen loads reaching the bioreactor due to larger drainage areas, more fertilizer-intensive crops (e.g., corn), and soils with high potential to leach nitrogen (e.g., sandy soils closer to surface water bodies). However, research to maximize the cost-effectiveness of bioreactors in the Mid-Atlantic through both design and targeting is ongoing.
In addition to optimizing bioreactor placement in the landscape, opportunities remain to improve performance by testing different materials to supplement the woodchips. For example, mitigating the effects of low pH, which can limit nitrate removal and increase N2O production, could be achieved by adding materials with a liming effect to the woodchips. As research on bioreactors matures, their performance is evaluated more holistically. In addition to measuring how much nitrate a bioreactor removes, the release of harmful byproducts is considered, including greenhouse gas emissions and excess dissolved organic carbon lost during the first flush of nutrients leached from fresh woodchips. Understanding the factors controlling the generation of harmful byproducts and accounting for them when determining the net environmental effect of bioreactors is important. Though denitrifying bioreactors are becoming useful tools for managing agricultural nonpoint source pollution, exciting opportunities to improve their performance and expand their application await.
Additional publications are available from Virginia Cooperative Extension that provide more information on denitrifying bioreactors (BSE-55P) and agricultural drainage (BSE-208P). For those seeking a deeper understanding of the concepts underlying agricultural drainage water management, other VCE publications of interest include those discussing denitrification management (BSE-54P), hydrology and the hydrologic cycle (BSE-191P), and soil and soil water relationships (BSE-194P).
Acknowledgments
Special thanks to Michael Andruczyk, Larry Geohring, Dough Horn, and Julie Shortridge for their time and effort in reviewing this document. We appreciate your feedback and have incorporated your helpful suggestions.
Glossary
artificial drainage – A modification of the landscape to more quickly drain excess soil water than would occur naturally. It is achieved by three primary means: (1) installing subsurface “tile” (perforated pipe) drains at some depth below the soil surface, (2) surface ditching, and (3) land shaping (usually used in conjunction with ditching or subsurface drainage).
best management practice (BMP) – As defined by the Natural Resources Conservation Service any program, process, design criteria, operating method, or device, which controls, prevents, removes, or reduces pollutions.
bioavailable – In a form that can be used by organisms (e.g., plants uptake NO3- but cannot use N2).
biochar – Similar to charcoal, this form of organic carbon is produced by burning organic material, such as plant material or animal waste, at low temperature in the absence of oxygen. The resulting product is resistant to decomposition. The method of production determines its best final use, such as a horticultural soil amendment to increase soil water-holding capacity.
concentration reduction – A decrease in the concentration (mass per unit volume) of a substance, usually expressed as a percentage, that is independent of the discharge (rate of mass transport).
constructed wetland – A wetland designed as a treatment system (such as for stormwater or wastewater) that uses natural processes involving wetland vegetation, soils, and associated microorganisms to improve water quality. Also known as an artificial wetland.
denitrifying bioreactor – A buried trench filled with an organic carbon source, typically woodchips, that intercepts drainage water with excess nitrate. This excess nitrate is removed by microorganisms that feed on the organic carbon and convert the nitrate nitrogen into nitrogen gas.
drainage network – The entire system of connected structures that removes water from the landscape and soil profile more quickly than would occur naturally. The drainage network is composed of ditches and/or subsurface drains.
drainage water management – The process of managing the timing and amount of water discharges from surface and/or subsurface agricultural drainage systems with water control structures.
greenhouse gas – A gas that absorbs infrared radiation and as a result traps heat in the atmosphere, which is termed the “greenhouse effect.” Examples include carbon dioxide (CO2), nitrous oxide (N2O), and methane (CH4).
head – The specific measure of water pressure above a reference point. Water always flows from higher hydraulic head to lower hydraulic head. Also known as hydraulic head.
hydrologic cycle – The cycle that describes how water moves through the environment, which includes two phases: the atmospheric phase, which describes the movement of water as gas (water vapor) and liquid/solid (rain and snow) in the atmosphere; and the terrestrial phase, which describes the movement of water in, over, and through the Earth.
hydrology – The study of the distribution, occurrence, circulation, and properties of water in the environment.
inert – In chemistry, a substance that is chemically inactive and not subject to transformation in chemical reactions.
load reduction – The cumulative decrease in the amount (mass) of a substance. For a substance dissolved in water, the load or load reduction is dependent on both the concentration of the substance and the flow rate of the water (the rate of mass transport).
soil water – Water stored in a soil that occupies the pore (open) spaces between soil particles.
stream buffer – The near stream area, usually forested, that shades and protects a stream from the impact of adjacent land uses by slowing runoff, filtering sediment and pollutants, and enhancing infiltration into the soil.
Related VCE Publications
Easton, Zachary M. 2022. How Do Stream Buffers Reduce the Offsite Impact of Pollution? VCE Publication BSE-38NP. https://www.pubs.ext. vt.edu/content/pubs_ext_vt_edu/en/BSE/BSE-38/ BSE-38P.html.
Easton, Zachary M., and Emily Bock. 2020. Hydrology Basics and the Hydrologic Cycle. VCE Publication BSE-191P. https://www.pubs.ext.vt.edu/BSE/BSE- 191/BSE-191.html.
Easton, Zachary M., and Emily M. Bock. 2021. Soil and Soil Water Relationships.” VCE Publication BSE- 194P. https://www.pubs.ext.vt.edu/BSE/BSE-194/ BSE-194.html.
Easton, Zachary M., Emily M. Bock, and Amy S. Collick. 2022. Factors When Considering an Agricultural Drainage System. VCE Publication BSE-208P. https://www.pubs.ext.vt.edu/content/ pubs_ext_vt_edu/en/BSE/BSE-208/BSE-208.html.
Easton, Zachary M., and Emily Lassiter. 2023.
Denitrification Management.” VCE Publication BSE-54P. https://www.pubs.ext.vt.edu/content/ pubs_ext_vt_edu/en/BSE/BSE-54/BSE-54.html.
Lassiter, Emily, and Zachary M. Easton. 2018. Denitrifying Bioreactors: An Emerging Best Management Practice to Improve Water Quality. VCE Publication BSE-55P. https://www.pubs.ext. vt.edu/content/pubs_ext_vt_edu/en/BSE/BSE-55/ BSE-55.html.
References
4R Nutrient Stewardship. 2023. “What Are the 4Rs?” Accessed July 23. https://nutrientstewardship. org/4rs/.
Christianson, Laura E., Amy S. Collick, Ray B. Bryant, Timothy Rosen, Emily M. Bock, Arthur L. Allen, Peter J. A. Kleinman, Edward B. May, Anthony
R. Buda, Judy Robinson, Gordon J. Folmar, and Zachary M. Easton. 2017. “Enhanced Denitrification Bioreactors Hold Promise for Mid-Atlantic
Ditch Drainage.” Agricultural & Environmental Letters 2 (1): 170032. https://doi.org/10.2134/ ael2017.09.0032.
Rosen, Timothy, and Laura Christianson. 2017. “Performance of Denitrifying Bioreactors at Reducing Agricultural Nitrogen Pollution in a Humid Subtropical Coastal Plain Climate.” Water 9(2): 112. https://doi.org/10.3390/w9020112.
USDA-NASS (U.S. Department of Agriculture. 2012 Census of Agriculture.) 2012. “Land Use Practices by Size of Farm: 2012.” 2012 Census, Volume1, Chapter 1: State Level Data. Table 50. https:// agcensus.library.cornell.edu/wp-content/uploads/ usv1.pdf.
USDA-NRCS (U.S. Department of Agriculture. Natural Resource Conservation Service.) 2020. Conservation Practice Standard, Denitrifying Bioreactor, Code 605. Technical Guide MD605-1, Section IV. Washington, D.C. https://www.nrcs. usda.gov/sites/default/files/2022-09/Denitrifying_ Bioreactor_605_NHCP_CPS 2020.pdf.
Virginia Cooperative Extension materials are available for public use, reprint, or citation without further permission, provided the use includes credit to the author and to Virginia Cooperative Extension, Virginia Tech, and Virginia State University.
Virginia Cooperative Extension is a partnership of Virginia Tech, Virginia State University, the U.S. Department of Agriculture (USDA), and local governments, and is an equal opportunity employer. For the full non-discrimination statement, please visit ext.vt.edu/accessibility.
Publication Date
December 11, 2023