

Agricultural Land Sales in Virginia, 2023
ID
AAEC-324P (AAEC-333NP)
 EXPERT REVIEWED
Past Agriculturlal Land Sale publications can be found on the VCE Annual Publications archive.
Abstract
This report is the successor to the 2021-2022 Agricultural Land Sales in Virginia report, providing an updated analysis of agricultural land sales in Virginia for 2023. The report looks at all market-based, arms-length agricultural land transactions at the county, district, and statewide level, analyzing both sales volume and sales price of agricultural land. Statewide transaction volume decreased by 32.2% for agricultural land of 20 acres or more and similar trends were found across all Land Classes. This significant decline reflects broader market conditions in 2023, with inflation and high interest rates causing high borrowing costs. The statewide estimate of the price of agricultural land was $5,434 per acre. Through examining trends at the statewide and district levels, this analysis offers valuable insights into the dynamics of the agricultural land market in the Commonwealth of Virginia in 2023.
Section 1: Motivation and Statewide Overview
Introduction
From early agricultural cultivation by the Native Americans to colonists’ reliance on tobacco as a cash-crop, agriculture has always been crucial to Virginia’s economy. In 2022, agriculture was the largest private industry in the Commonwealth, collecting $82.3 billion in annual revenue (VDACS, 2024). Agricultural properties are not only an asset for production but also an investment. In 2024, farm real-estate made up 84% of total farm sector assets for the United States (USDA ERS, 2024). This report analyzes sales volume and sales prices of farmland to help understand trends in Virginia’s agricultural land market. It serves as a resource for policymakers, developers and landowners seeking to understand patterns in agricultural land transactions across the Commonwealth.
This report differs from the USDA’s National Agricultural Statistics Service (NASS) Land Values and Cash Rents report’ as it reflects actual market transaction data reported to the Virginia Department of Taxation, rather than NASS’s opinion-based landowner valuation surveys. The procedures and research processes of this report remain similar to the 2021-2022 report, with a revised method surrounding improvement values outlined in the ‘Methods and Procedures’ section below. Property sales trends, regional variations, and factors influencing land values are discussed herein. Throughout this report, reference to “agricultural land” or “agricultural property” and their derivatives means unimproved land consisting of 20 or more acres, whether used as farmland, forestland or open space.
The Data
Land parcel transactions are divided into six classifications, further described in Section 3. Land Class 5 (undeveloped parcels greater than 20 acres but less than 100 acres) and Class 6 (undeveloped parcels greater than 100 acres) were compiled into a single transaction database for 2023. Each locality in Virginia independently submits this data to the Virginia Department of Taxation. While this covers a vast majority of agricultural land transactions, the self-reported nature of the data implies that some counties may report incomplete or missing entries from some counties. The 2023 database of Land Class 5 and 6 transactions included 1,805 transactions before data validation and cleaning. Each transaction in the database includes the locality, PIN or parcel number, reconsideration date, instrument number, grantor and grantee, assessed value, sales price, acreage, and a description of the parcel. These transactions represent ‘fair market value’ transactions as these are arm’s-length transactions in an open market. Thus, the sales price reflects the fair market value of the property.
Research Purpose
Statistics in this report should be regarded only as indicators of past general conditions in the agricultural real estate market. The reported data does not represent prices or values of any particular parcel. However, the statistics do provide a general guide to Virginia agricultural land market values and geographic trends. Users should not regard these reported statistics as a substitute for an appraisal or market study of current local sales. This analysis reflects historical Virginia agricultural land markets and does not forecast future market values. The analyzed data may encompass forestland as well as open or undeveloped land that may not be suitable for some agricultural use.
Methods and Procedures
Data analysis began with a rigorous validation process for all 1,805 reported transactions, using each PIN or parcel number to validate the acreage and sale prices in each locality’s GIS database. Parcels with missing or unverifiable sales information, transactions from erroneous reporting years, and transactions under 20 acres were removed. Parcel improvement values were factored into the data analysis and outlier removal process, removing transactions which included improvement values of $300,000 or more.
The American Housing Survey is a biennial survey conducted by the U.S. Census Bureau, collecting information on the “size, composition, and quality of the nation’s housing” (US Census Bureau 2021). The most recent reported median structure value for owner-occupied units nationwide is $300,000 (American Housing Survey 2024). Accordingly, this value was used as a conservative cut-off for improvement values to ensure properties with high structure value do not skew the valuation analysis of agricultural land. It also ensures that the value of smaller improvements such as barns, fences and roads are retained.
Improvement value represents the value of any dwellings, buildings or other improvements on the property, separate from the land itself (Orange County, n.d.). Recorded during property assessments, the improvement value helps separate value from any structures on the land from the value of the land itself. Examples of property improvements range from structures as small as fences, barns and roads, to high-value additions such as residential homes or even commercial buildings. Out of the 1,805 properties analyzed in this study, 601 had improvement values ranging from $200 to $4,069,640.
As seen in the histogram, the properties with improvement values generally show improvement values greater than $100,000 with the average being $294,501 shown by the red line (fig. 1). With the data being skewed right, properties with high improvement values are considered outliers for this study as the sales price may more accurately reflect structure value than land value.
When analyzing the 2023 data, 601 properties with improvement values saw a 65% higher statewide mean and 90% higher statewide median dollar-per-acre value compared to the 1,204 properties without improvement values. This difference in dollar per acre reflects the impact of unrestricted improvement values skewing the land valuation analysis.
Step in the data analysis process |
Number of Transactions |
Mean $/acre |
Median $/acre |
|---|---|---|---|
Initial Cleaned Dataset |
1,805 |
11,427 |
5,238 |
Parcels with improvement values |
601 |
15,766 |
10,028 |
Parcels with >$300,000 improvement value (removed) |
192 |
33,616 |
26,862 |
Parcels greater than 1.5*IQR (removed) |
146 |
30,764 |
24,117 |
Final Dataset |
1,461 |
5,434 |
4,250 |
The $300,000 threshold for improvement value removed 192 parcels from the analysis, bringing the dataset from 1,805 observations down to 1,613. Data that remained after the cleaning and validation were tested for statistical outliers using a box plot method. Any transactions with a value above or below 1.5*IQR (interquartile range) were removed. After removing parcels exceeding the improvement value threshold, the IQR method removed 146 additional upper outliers from the dataset, resulting in a final dataset of 1,461 cleaned observations of Virginia agricultural land transactions.1 A majority of the removed outliers, whether due to high improvement values or the box-plot method, were concentrated in the higher dollar per acre range. Thus, more upper outliers being removed than in prior years’ studies may be one factor causing a lower reported land values compared to previous years’ studies. Accordingly, observations of year-to-year comparisons below should take into account the difference in report methodologies.
1 The method of factoring in improvement values resulted in a lower number of total observations compared to previous years
Statewide Overview
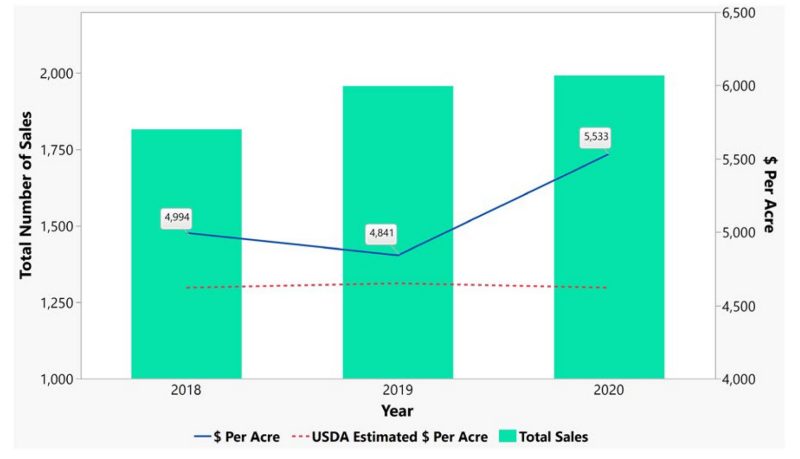
Virginia agricultural land sold in 2023 averaged $5,464 per acre, with transaction volume decreasing to 1,461 transactions from 2,159. This represents a 32.3% decrease in total transactions (See Figure 1). The NASS survey of agricultural land values estimated an average of $5,300 per acre (USDA - National Agricultural Statistics Service, n.d.). Similarly, the Virginia Sales/Assessment Ratio study, discussed in Section 3, reported an 18.2% decrease in agricultural transaction volume (Klos, 2024). Both findings indicate a slowdown in land transactions since the recent height of the real estate market after the COVID-19 pandemic.

Land sales price in 2023 varied widely, showing a similar distribution as 2022 even with fewer total transactions. Seventy-six percent of 2023 land sales were less than $7,000 per acre, 22% were between $7,000 and $13,000, and 5.7% were over $13,000 per acre (See Figure 2).

In 2023, there was a notable decrease in high-value transactions, with only 29 parcels selling for over $15,000 per acre compared to 209 in 2022 (See Figure 3).2
2 This is in part a reflection of the improvement value threshold incorporated for this 2023 report which removed 192 parcels from the dataset, 161 of which had a dollar-per-acre greater than $15,000.

Similar to previous years, smaller parcels were more frequently transacted than larger parcels. In 2023, 83% of transactions occurred in Land Class 5, compared to only 17% classified as Land Class 6. The average acreage of all 2023 transactions was 66 acres, with 44% of all sales being between 20 and 39 acres.

Even before data cleaning and outlier removal, 2023 saw 699 fewer total transactions than years prior, decreasing from 2,530 to 1,805 transactions reported. Relatedly, the total acres sold in Virginia decreased by 49,870 acres. Average acreage per sale remained relatively constant, decreasing slightly from 67.5 to 65.7 acres. Overall, there was not a significant shift in the size of agricultural parcels bought and sold. However, a significant decrease in the total number of transactions was observed, which may in part be attributed to high interest rates to combat concurrent inflation, as well as higher than normal transaction volume during the pandemic, though this report does not analyze these contributing factors or others.
Below, readers will see counties with the highest agricultural land values in dark red, while lower value counties in lighter red to white. The highest-value counties in this analysis were York County ($17,551 per acre), King George ($17,180 per acre), Chesapeake ($17,217 per acre), Stafford ($15,732 per acre), and Mathews ($12,695 per acre). Areas in southwest Virginia tended to have lower prices per acre, while Northern Virginia and coastal regions on the Chesapeake Bay showing higher prices per acre for agricultural land.

Section 2: Regional Overview
USDA establishes Agricultural Statistics Districts (ASD), grouping together contiguous groups of counties with relatively similar agricultural characteristics (USDA National Agricultural Statistics Service 2018). Metrics were calculated for each of these districts to investigate which districts were leading changes in statewide trends. Below, Figure 7 shows each of the seven agricultural districts in Virginia and Table 2 displays the district averages and median prices per acre.

As in years past, the Northern District still saw the highest mean land values at $8,854 per acre in 2023. The Northern District also saw the biggest change in average land value, decreasing by 21.6% from 2022. The Eastern District showed a notably different trend than the rest of the state, with a 3.4% increase in average sales price per acre and a 30.2% increase in median sales price per acre. All other districts saw at least a 7% decrease in mean sales price for acre. While the statewide average decreased by 16.5%, the median sale price per acre only decreased by 2.5%. The decrease in average price per acre on the state and district level was expected because of the more robust upper outlier standards for the improvement value methodology. While these upper outliers heavily skew the mean, a less significant change in the median was expected, as shown by the 2023 data.
|
Central District |
Eastern District |
Northern District |
Southeastern District |
Southern District |
Southwestern District |
Western District |
State Totals |
|---|---|---|---|---|---|---|---|---|
| Mean price per acre ($) | $6,283 | $5,910 | $8,854 | $4,507 | $4,133 | $4,463 | $5,957 | $5,434 |
| Median Price per acre ($) |
$5,131 |
$4,775 |
$9,094 |
$3,374 |
$3,240 |
$3,535 |
$4,973 |
$4,251 |
Below is a breakdown of recorded transactions in each district from the raw data, with the Central and Southwestern districts seeing the most transactions overall.
District |
2021 |
2022 |
2023 |
|---|---|---|---|
Central |
823 |
644 |
501 |
Eastern |
275 |
253 |
142 |
Northern |
388 |
273 |
229 |
Southeastern |
205 |
159 |
132 |
Southern |
433 |
408 |
254 |
Southwestern |
785 |
581 |
444 |
Western |
244 |
212 |
126 |
Total (Difference Ratio) |
3,153 (16.7) |
2,530 (14.7) |
1,828 (20.04) |
Overall transaction volume and acres sold decreased across all counties from 2022 to 2023. The Southwestern District saw both the highest total transactions and the highest total acreage.
3 These values represent the original data from the Virginia Department of Taxation.
District |
2022 No. of Sales |
2023 No. of Sales |
2022 Total Acres Sold |
2023 Total Acres Sold |
|---|---|---|---|---|
Central |
533 |
365 |
35,980 |
22,695 |
Eastern |
179 |
124 |
15,479 |
8,176 |
Northern |
195 |
113 |
10,696 |
7,490 |
Southeastern |
152 |
111 |
11,887 |
9,620 |
Southern |
393 |
235 |
25,965 |
15,122 |
Southwestern |
530 |
411 |
32,764 |
27,260 |
Western |
177 |
101 |
13,121 |
6,369 |
Total |
2,159 |
1,460 |
145,892 |
96,735 |
Section 3: Virginia Real Estate Class Trends
The Virginia Assessment/Sales Ratio Study (Sales Ratio Study) is an annual study conducted by the Virginia Department of Taxation, estimating various real estate valuation metrics for every county and city in Virginia (Klos, 2024). Figure 8 summarizes data from this study from 2017 to 2023 for each of the six Land Classes: single-family residential urban (Class 1), single-family residential suburban (Class 2), multi-family residential (Class 3), commercial and industrial (Class 4), agricultural land 20 to 100 acres (Class 5), agricultural land over 100 acres (Class 6). The years 2020 and 2021 saw a tremendous spike in real estate sales during the COVID-19 pandemic with interest rates reaching record-low levels of 2.65% (Federal Reserve Economic Data 2023). However, 2022 and 2023 have seen a subsequent drop in overall transaction volume in the Commonwealth. To combat inflation, interest rates in 2023 were the highest they’ve been since 2001, with the average mortgage rate reaching 6.81% (Federal Reserve Economic Data 2023). Rising interest rates raise the long-term cost of real estate mortgages, which may have contributed to the decline in sales over the past two years. In the Virginia Realtors 2023 Housing Market Report, overall home sales activity was reported to be the lowest since 2014, attributing the decrease to “climbing mortgage rates and a lack of inventory” (Price 2023). The Virginia Realtors data showed the lowest total home sales since 2014 (Price 2023). While less drastic than the Virginia Realtors study, the Virginia Department of Taxation also found a decrease in transaction volume across each of the six Land Classes.
4 Final data obtained through selection and validation process

Single-family residential urban and suburban land comprised 44.67% and 20.03% share of total sales in 2023 respectively, showing residential housing still leads the real estate market. According to the Sales Ratio study, total land transactions decreased by 20.4% from 122,649 to 97,572 from 2022 to 2023 (Klos, 2024). Agricultural Land Sales, Class 5 and 6 combined, saw an 18.2% reduction in total sales volume, however their share of the land market remained similar. Land Class 5 comprised 1.2% of Land Sales, Class 6 with 0.21% of land sales, for a total 1.44% share of the market for agricultural land as a whole. Land Class 6, agricultural land over 100 acres, saw the smallest market share, with Land Class 3, multi-family residential, following close behind at 0.44%.
Property Classification |
2019 |
2020 |
2021 |
2022 |
2023 |
|---|---|---|---|---|---|
Class 1 |
81,510 |
82,896 |
99,846 |
84,504 |
64,078 |
Single-family residential urban |
69.00% |
68.60% |
69.61% |
58.92% |
44.67% |
Class 2 |
30,975 |
33,273 |
36,900 |
32,025 |
28,723 |
Single-family residential suburban |
26.20% |
27.50% |
25.73% |
22.33% |
20.03% |
Class 3 |
878 |
677 |
1,093 |
872 |
624 |
Multi-family residential |
0.74% |
0.56% |
0.76% |
0.61% |
0.44% |
Class 4 |
2,340 |
1,569 |
2,413 |
2,724 |
2,083 |
Commercial and industrial |
2.00% |
1.30% |
1.68% |
1.90% |
1.45% |
Class 5 |
1,997 |
2,076 |
2,655 |
2,117 |
1,759 |
Agricultural 20- 100 acres |
1.70% |
1.71% |
1.85% |
1.48% |
1.23% |
Class 6 |
361 |
352 |
525 |
407 |
305 |
Agricultural over 100 acres |
0.31% |
0.29% |
0.37% |
0.28% |
0.21% |
Total |
118,061 |
120,843 |
143,432 |
122,649 |
97,572 |
|
100% |
100% |
100% |
100% |
100% |
Class 5+6 Total |
2,358 |
2,428 |
3,180 |
2,524 |
2,064 |
|
1.90% |
2.00% |
2.22% |
1.76% |
1.44% |
Source: “Virginia Sales/Assessment Ratio Study,” Virginia Department of Taxation, 2024.
The Virginia Sales/Assessment Ratio studies showed similar trends to the data analyzed in Sections 1 and 2 above. Since the real estate boom during COVID-19, land transactions have slowed within Virginia with a 20.4% decrease in overall transaction volume, and an 18.2% decrease in agricultural transactions specifically. (Sales Ratio Study). In comparison, the analysis in Sections 1 and 2 found a 27.7% decrease in total transactions for agricultural land from the raw data.
Summary and Conclusions
Utilizing available data from the Department of Taxation, this study summarizes observed trends in agricultural land transactions in 2023 for the Commonwealth of Virginia. This analysis of arms-length transactions for agricultural and undeveloped land in the Commonwealth of Virginia is not a forecast of future land market conditions but rather a look into past market values and trends. This analysis included a new outlier removal method, collecting data on improvement values for each transaction. Any parcels with improvement values exceeding the U.S. Census Bureau’s median structure value for owner-occupied units were removed prior to the IQR outlier removal used in previous years’ reports. This resulted in a smaller sample size and fewer high-value parcels analyzed. The average price-per-acre in Virginia was $5,434 with an average of 65.7 acres per sale for this sample. Across Virginia, agricultural land sales still comprise a small share of total land transactions in Virginia, as seen by data in Section 3 from the Virginia Sales/Assessment Ratio studies. Agricultural land saw another year of declining sales with respect to total transaction volume and total acres sold, aligning with broader market conditions showing a slowdown in the real estate market. Macroeconomic factors such as high borrowing rates, inflation, and low housing supply are contributing factors to this slowdown.
References
Federal Reserve Economic Data. “30-Year Fixed Rate Mortgage Average in the United States.” FRED Economic Data. Accessed January 2025. https://fred.stlouisfed.org/series/MORTGAGE30US
Hellerstein, D., D. Vilorio, and M. Ribaudo, eds. 2019. Agricultural Resources and Environmental Indicators, 2019. U.S. Department of Agriculture, Economic Research Service. No. 1476-2019-1679. https://www.ers.usda.gov/publications/pub-details/?pubid=93025.
Klos, Stephen. December 19, 2024. “The Virginia Assessment/Sales Ratio Study For Tax Year 2023.” Accessed January 2025. https://www.tax.virginia.gov/sites/default/files/inline-files/2023-assessment-sales-ratio- study.pdf
Orange County. n.d. “Commissioner of the Revenue FAQs.” Accessed January 2025. https://www.orangecountyva.gov/FAQ.aspx?QID=230
Price, Ryan. “Virginia Home Sales Report December 2023.” Virginia Realtors, 2023. Accessed January 2025. https://virginiarealtors.org/research/reports/home-sales-reports/december-2023-home-sales-report/
United States Census Bureau. 2021. “American Housing Survey (AHS) – About.” Accessed January 2025. https://www.census.gov/programs-surveys/ahs/about.html
American Housing Survey (AHS). 2024. “American Housing Survey Table Creator.” Accessed January 2025. https://www.census.gov/programs-surveys/ahs/data/interactive/ahstablecreator.html
United States Department of Agriculture (USDA) National Agricultural Statistics Service. 2018. “County Data FAQ’s.” United States Department of Agriculture. Accessed January 2025. https://www.nass.usda.gov/Data_and_Statistics/County_Data_Files/Frequently_Asked_Questions/
Virginia Department of Agriculture and Consumer Services. n.d. “Virginia Agriculture Facts and Figures.” Accessed May 2023. https://www.vdacs.virginia.gov/markets-and-finance-agriculture-facts-and-figures.shtml
Virginia Cooperative Extension materials are available for public use, reprint, or citation without further permission, provided the use includes credit to the author and to Virginia Cooperative Extension, Virginia Tech, and Virginia State University.
Virginia Cooperative Extension is a partnership of Virginia Tech, Virginia State University, the U.S. Department of Agriculture (USDA), and local governments, and is an equal opportunity employer. For the full non-discrimination statement, please visit ext.vt.edu/accessibility.
Publication Date
March 25, 2025
