

Enterprise Budgets for Trout Production in Idaho
ID
AAEC-276NP
Introduction
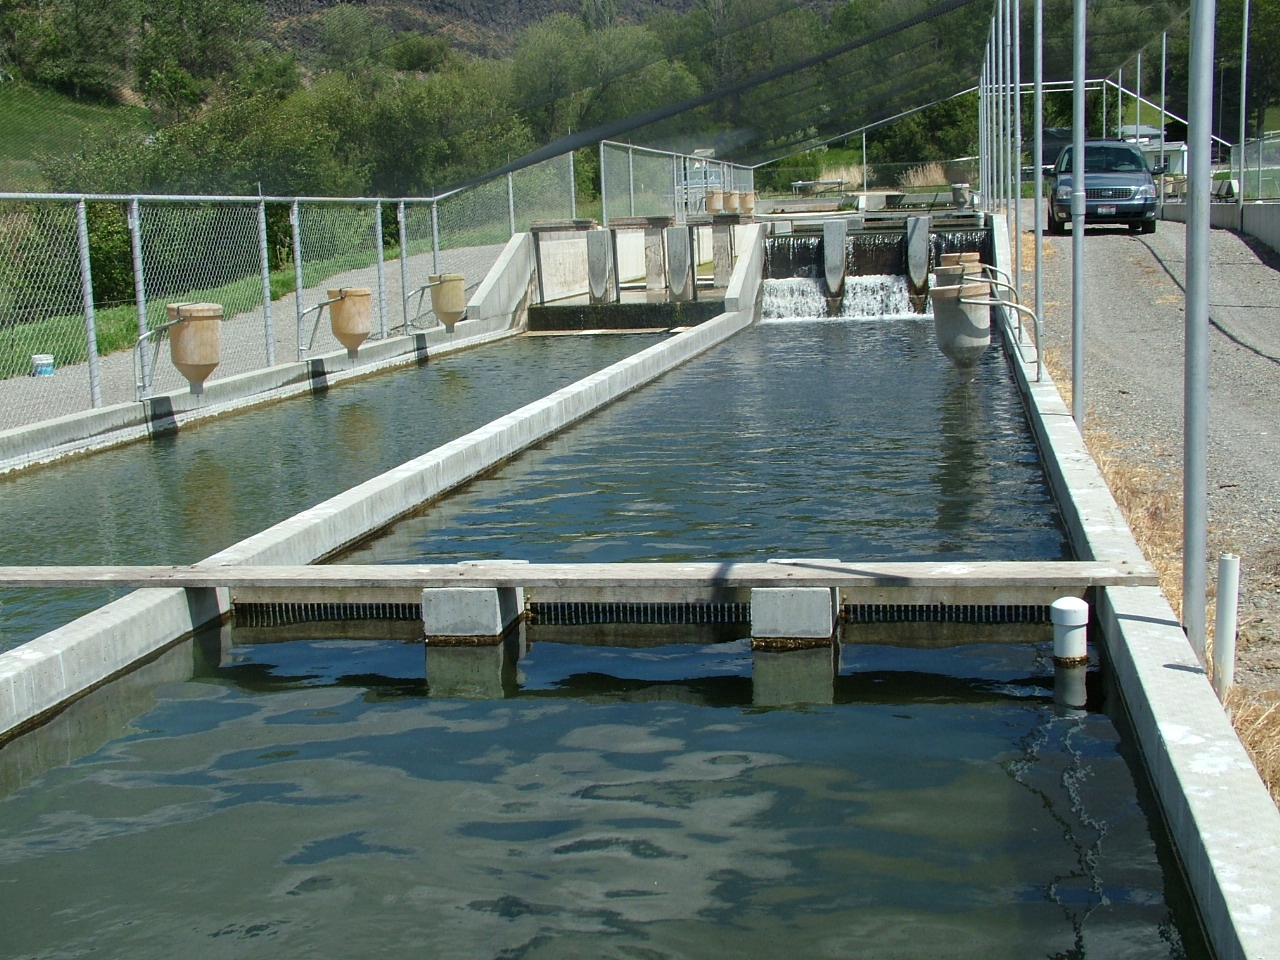
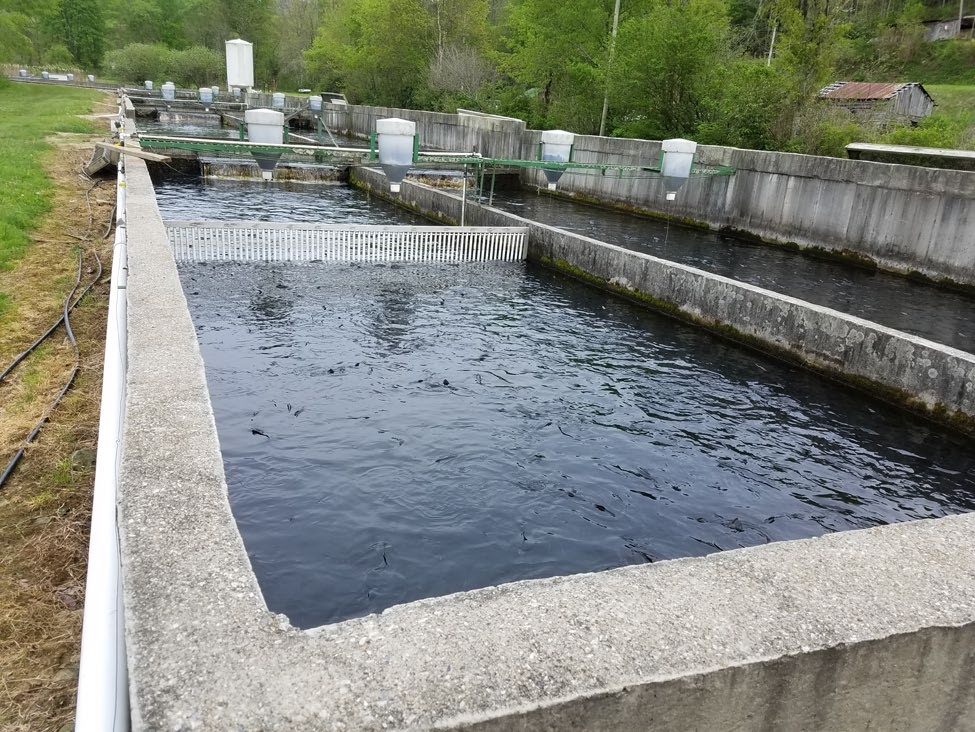
Idaho is the leading trout-producing state in the U.S. In 2018, Idaho produced 56% of the national production of foodsized trout (27.6 million pounds) (USDA-NASS 2019). Trout farming in Idaho dates back to 1909, and today approximately 98% of Idaho’s aquaculture production occurs in Twin Falls, Gooding and Jerome counties, with about 70 fish farms in the Magic Valley. Most of the trout raised in Idaho are processed and sold as boneless fillets as well as dressed trout, jerky, and smoked products. While most Idaho trout are sold for food, some Idaho trout are sold into recreational markets. This fact sheet, however, focuses on costs of producing trout for foodfish. The major species of trout raised for foodfish is the rainbow trout (Oncorhyncus mykiss). The flow-through raceways used to produce trout are mostly concrete but there still are some earthen raceways. Trout farms in Idaho range from production scales of approximately 60,000 lb/year of production to very large businesses that sell more than 500,000 lb/yr. The budget presented in this fact sheet is for a farm production scale of 90,000 lb, based on data from a 2018 national survey of the U.S. trout industry (Engle et al. 2019).
How to Use an Enterprise Budget
An enterprise budget can be useful to provide a general estimate of average costs, returns, profitability, and breakeven prices (costs per lb of production) of a farm. It should be viewed as a guide in terms of what types of expenses are likely to occur and, for an average year, whether the trout business would be expected to be profitable or not. A different financial statement, the Profit and Loss Statement (also called the “P and L” or “income statement”) details the actual revenue and expenses for each year of the business. It is often prepared by the accountant for the farm. For additional details on P and L’s, see Engle (2012a; Engle 2019). It is important to understand that each farm is different in terms of whether most of the labor is hired or provided by the owner and family, how much capital has been borrowed, the size and condition of the production facilities, and other factors.
Thus, each farmer and prospective farmer should begin their financial planning with a generalized enterprise budget but substitute values that are as accurate as possible for the specific farm being analyzed.
A comprehensive enterprise budget includes three to four separate tables. The first of these is a table that itemizes all the necessary long-term investment capital items. For a trout farm, the amount of land and its cost, the number of raceways and their initial construction costs, and all buildings (such as a hatch house, office building, shop or equipment building) would be included in this first table. The second table itemizes all equipment investment items from vehicles used to grow trout, including tractors, mowers, feeders, harvest equipment, and pumps, among others. If the farm includes a hatchery, a third table would be needed to include equipment used to spawn and hatch trout eggs. For the long-term investment and equipment tables, it is important to assign a useful life for each item listed in the table to calculate annual depreciation for each asset. The initial construction cost is divided by the years of useful life to estimate the annual depreciation value. Annual depreciation is, of course, not a cash cost for the business. However, to stay in business requires that the trout farm generate enough revenue to be able to replace each piece of equipment and building when it wears out. Without accounting for annual depreciation, the business may not be able to replace essential equipment and may be forced to shut down. The last table in a comprehensive enterprise budget is that of the annual costs and returns. Each type of operating expense is itemized in the annual cost and returns table, clearly identifying the quantity required of each input and its associated cost. The operating costs are summed into total variable costs that are then added to the sum of all fixed costs to obtain total costs. Profit is then measured as “net returns” by subtracting total annual costs from annual receipts.
Idaho Trout Foodfish Production Budgets
Tables 1 to 4 present a complete enterprise budget for a smaller-scale trout farm (producing 90,000 lb/year) that sells foodfish trout to a processing plant. Table 1 itemizes the land, buildings, and raceways necessary for the farm. The total initial investment cost is included as is the annual depreciation cost (calculated throughout this fact sheet using the straight-line method assuming zero salvage value; often the case as farms take full advantage of all remaining materials). The total initial investment for the farm is $110,200, with annual depreciation of $5,417.
| Item | Unit | Quantity | Cost/ unit |
Total initial investment cost | Years of useful life | Annual depreciation |
|---|---|---|---|---|---|---|
| Land | acre | 2 | 2,600 | $5,200 | n.a. | n.a. |
| Buildings Storage building | each | 1 | 10,000 | $10,000 | 15 | $667 |
| Hatchery/ office |
each | 1 | 45,000 | $45,000 | 20 | $2,250 |
| Raceways | total | 1 | 50,000 | $50,000 | 20 | $2,500 |
| TOTAL | $110,200 | $5,417 |
Table 2 presents the total initial cost and annual depreciation for equipment typically used for this size of trout farm while Table 3 provides this same information for equipment used for a hatchery on the farm. Trout farms vary greatly in terms of whether they own and maintain their own broodstock, purchase eggs from hatcheries, or purchase fingerlings to stock into growout raceways. The survey data used for this fact sheet shows that there tend to be relatively more farms that purchase eggs to hatch on their farm; thus, this foodfish production budget included the investment costs of a hatchery with the necessary equipment to hatch eyed trout eggs on site.
| Item | Quantity | Unit cost | Total initial cost | Useful life (yr) | Annual depreciation |
|---|---|---|---|---|---|
| Tractors | 1 | $20,000 | $20,000 | 20 | $1,000 |
| Trucks | 1 | $33,000 | $33,000 | 15 | $2,200 |
| Fish hauling tanks | 1 | $5,000 | $5,000 | 15 | $333 |
| Regulator & accessories | 1 | $585 | $585 | 5 | $117 |
| Oxygen cylinders | 2 | $220 | $440 | 7 | $63 |
| Mower | 1 | $3,500 | $3,500 | 5 | $700 |
| Demand feeders/feed delivery system | 1 | $5,400 | $5,400 | 10 | $540 |
| Trailer sprayer | 1 | $1,791 | $1,791 | 10 | $179 |
| Pressure washer | 1 | $358 | $358 | 5 | $72 |
| DO meter | 1 | $800 | $800 | 5 | $160 |
| Water test kit | 1 | $294 | $294 | 2 | $147 |
| Office furnishings | 1 | $1,194 | $1,194 | 10 | $119 |
| Air conditioner/heater | 1 | $478 | $478 | 5 | $96 |
| Computer | 1 | $1,300 | $1,300 | 5 | $260 |
| Fish pump | 1 | $10,000 | $10,000 | 15 | $667 |
| Digital scale | 1 | $500 | $500 | 5 | $100 |
| Rifle w/scope | 1 | $500 | $500 | 5 | $100 |
| Waders | 4 | $105 | $420 | 1 | $420 |
| Nets | 3 | $150 | $450 | 5 | $90 |
| Graders/crowders | 3 | $150 | $450 | 10 | $45 |
| Total | $86,460 | $7,408 |
aMost farms of this size use bagged, not bulk, feed that would require a feed bin.
| Item | Quantity | Unit cost | Total initial cost | Useful life (yr) | Annual depreciation |
|---|---|---|---|---|---|
| Tanks/troughs | 10 | $500 | $5,000 | 10 | $500 |
| Pipe, valve, accessories | 8 | $42 | $336 | 8 | $42 |
| Upflow incubators | 3 | $1,500 | $4,500 | 10 | $450 |
| Belt feeders | 10 | $120 | $1,200 | 5 | $240 |
| Scale | 2 | $269 | $538 | 5 | $108 |
| Nets | 10 | $27 | $270 | 2 | $135 |
| TOTAL | $11,844 | $1,475 |
Table 4 presents the annual costs and returns for trout production for foodfish in raceways for this farm scenario. Values used were median values from the survey data from Idaho. The first line of the costs and returns table is that of gross receipts for an average year of the trout farm. Gross annual receipts were obtained by multiplying the quantity sold by the sales price ($/lb).
The next lines itemize the various types of cost expenses on the trout farm, beginning with variable costs and then annual fixed costs. Variable costs (also called “operating costs”) are those costs that vary with the level of production. For example, the more trout that are produced, the greater will be the quantity of feed fed, and the greater the overall feed cost. Since this budget is based on survey data, the costs were calculated in $ per pound for each type of expense. For this farm scenario, feed was the greatest annual cost and was followed by payroll. In this budget, total payroll included both management and labor costs because respondents to the survey tended to include both in their responses to those survey questions.
A quick way to determine if the farm business would be expected to cover its variable costs is to calculate what is called “income above variable costs” by subtracting total variable costs from gross receipts. If the gross receipts are not sufficient to cover total variable costs, the business will have serious cash flow difficulties that must be corrected quickly to avoid serious financial repercussions.
The next section of the budget is that of fixed costs that include expenditures that will be incurred regardless of the quantity of fish produced. Examples of fixed costs include property taxes, permits and licenses, farm insurance, and regulatory compliance costs. Other fixed costs are either non-cash costs such as annual depreciation on buildings and equipment or opportunity costs of the capital invested (valued at current interest rates). Opportunity costs of capital are important because they capture the value of the use of capital regardless of whether that cost is the interest paid to the bank on loans or what that capital would have earned if invested in another type of enterprise. Charging the use of capital as a fixed cost is appropriate in an enterprise budget because the budget is a generalized model of the annual costs and returns. Opportunity costs are not included in profit and loss statements that measure actual revenue and expenses for each year (annual depreciation is included in P and L statements).
Profitability is measured as net returns in the enterprise budget (Table 4). It is calculated by subtracting total annual costs (sum of all fixed and variable costs) from gross receipts. Table 4 shows that annual net returns for the 90,000 lb/year trout farm were positive, at $890. While profitable, these net returns appear to be low. However, it is important to understand that a comprehensive enterprise budget accounts for all capital and personnel time, even if an individual farm does not spend cash for that item. For example, a farm that has paid off all mortgages on land, buildings, and other facilities, does not pay interest on that investment, and the accounting profit for this farm would be much higher, $13,402 (adding the interest on investment back in to net returns). What net returns from a comprehensive enterprise budget does show is that, when net returns are positive, it is likely to be economically successful in the long run because it is making good use of all capital and other resources required for the business.
Finally, the enterprise budget includes calculations of breakeven prices and yields. Breakeven prices are the cost per pound of production. For the farm to be profitable, breakeven prices must be less than the market price of the product. Thus, breakeven prices provide a means to understand the profitability of the business at a quick glance. When calculated above only variable costs, breakeven prices show whether the variable costs would be covered by the revenue received, which is important for short-term profitability. For evaluating long-term profitability, it is important to focus on breakeven prices calculated above total costs that include all fixed costs. For the 90,000 lb/year farm, the price would need to be at least $1.40/lb to cover all costs (cash and the non-cash opportunity costs and depreciation). The breakeven yield of 89,369 lb/year shows the minimum quantity of fish that need to be produced to break even at the price used in the budget.
| Item | Unit | Quantity | Price/unit | Total |
|---|---|---|---|---|
| Gross receipts | ||||
| Trout | lb/yr | 90,000 | $1.41 | $126,900 |
| Variable costs | ||||
| Total fish purchases | $/lb | 90,000a | $0.030 | $2,700 |
| Feed | tons/yr | 58.5 | $850b | $49,725 |
| Payroll | $/lb | 90,000 | $0.20 | $18,000 |
| Therapeutants, disinfectants, etc. | $/lb | 90,000 | $0.0005 | $45 |
| Utilities (electricity, natural gas) | $/lb | 90,000 | $0.003 | $270 |
| Fuel (gas, diesel | $/lb | 90,000 | $0.045 | $4,050 |
| Telephone/radio/internet | $/lb | 90,000 | $0.020 | $1,800 |
| Repairs and maintenance (equipment) | $/lb | 90,000 | $0.045 | $4,050 |
| Office | $/lb | 90,000 | $0.01 | $900 |
| Miscellaneous | $/lb | 90,000 | $0.03 | $2,700 |
| Interest on operating capital | $ | 84,240 | $0.075 | $6,318 |
| Total variable costs | $90,558 | |||
| Income above variable costs | $36,342 | |||
| Fixed costs | ||||
| Property taxes | $/lb | 90,000 | $0.030 | $2,700 |
| Legal/accounting | $/lb | 90,000 | $0.020 | $1,800 |
| Permits & licenses | $/lb | 90,000 | $0.006 | $540 |
| Farm insurance | $/lb | 90,000 | $0.030 | $2,700 |
| Effluent discharge regulations | $/lb | 90,000 | $0.010 | $900 |
| Interest on investment Real estate, long-term Equip. for production Equipment for hatchery |
$ $ $ |
110,210 86,460 11,844 |
$0.06 $0.06 $0.06 |
$6,613 $5,188 $711 |
| Depreciation Real estate, long-term Equipment for production Equipment for hatchery |
$ $ $ |
5,417 7,408 1,475 |
$1.00 $1.00 $1.00 |
$5,417 $7,408 $1,475 |
| Total fixed costs | $35,452 | |||
| Total cost | $126,010 | |||
| Net returns | $890 | |||
| Breakeven price | ||||
| Breakeven price above variable costs | $1.01 | |||
| Breakeven price above total costs | $1.40 | |||
| Break-even yield | ||||
| Breakeven yield above variable costs | 64,226 | |||
| Breakeven yield above total costs | 89,369 | |||
a Survey data show that some farms purchase eggs, fingerlings of various sizes, broodstock, or at times other fish sizes. The costs of all fish purchases were summed in the survey data and divided by the total number of pounds of fish sold for each farm. That value was then averaged across all farms in this size/market-type category, to get a fish purchase price per pound of trout sold. Thus, the “total fish purchases” line item cost includes purchases of all fish sizes and is applied to the total weight sold by this farm; it is not simply a number of eggs or fingerlings that might imply 100% survival.
b Feed price inflated by 25% to account for higher price of fingerling feed. Survey data was presented as total dollars of feed.
Summary
Trout farms have developed over time based on the many decisions made by farm owners and managers in terms of the markets to target, the sizes and volume of trout to be raised, available resources, and many other factors. Both costs and revenue vary with the different business models that have developed over time in the trout farming industry. Thus, the generalized values presented in this enterprise budget should not be used as definitive projections, but rather as guidelines for tailoring a budget to a specific, well thought out business model. Additional information on business planning for aquaculture farms is readily available (see Engle 2012a,b,c,d; 2019 for additional details).
The budget presented in this fact sheet was based on farm data from a 2018 national survey of trout farms, and not on hypothetical farms. Prices received and various types of costs differed across farm sizes, the type of market targeted, and from farm to farm. Economies of scale exist in trout farming, but there are multiple examples of successful smaller-scale trout farms that have developed market niches with higher prices that have resulted in profitable businesses.
Trout farming in the U.S. is generally profitable. Nonetheless, it is critical for trout farmers to review and analyze their financial statements periodically. Financial statements offer clues as to the strengths and weaknesses of the business and suggest opportunities to improve financial performance. Prospective trout farmers, especially, are well advised to think through the details of their proposed business and substitute realistic estimates of revenues and costs, using the information in enterprise budgets such as this one as a guide only.
References
Engle, C.R., 2012a. Determining the Profitability of an Aquaculture Business: Using Income Statements and Enterprise Budgets. SRAC Publication No. 4402, Southern Regional Aquaculture Center, Stoneville, Mississippi.
Engle, C.R. 2012b. Introduction to Financial Management of Aquaculture Businesses. SRAC Publication No.4400, Southern Regional Aquaculture Center, Stoneville, Mississippi.
Engle, C.R., 2012c. Assessing the Financial Position of an Aquaculture Business: Using Balance Sheets. SRAC Publication No. 4401, Southern Regional Aquaculture Center, Stoneville, Mississippi.
Engle, C.R., 2012d. Evaluating the Liquidity/Cash Position of an Aquaculture Business: Using Cash Flow State- ments. SRAC Publication No. 4403, Southern Regional Aquaculture Center, Stoneville, Mississippi.
Engle, C.R. 2019. Aquaculture Businesses: A Practical Guide to Economics and Marketing. 5M Publishing, UK. Engle, C.R., J. van Senten, and G. Fornshell. 2019. Regulatory costs on U.S. salmonid farms. Journal of the World Aquaculture Society 50(3):522-549;
doi.org/10.1111/jwas.12604.
USDA-NASS. 2019. 2018 Census of Aquaculture. National Agricultural Statistics Service, United States Department of Agriculture, Washington, District of Columbia, USA. Available at:
https://www.nass.usda.gov/Surveys/Guide_to_NASS_Surveys/Census_of_Aquaculture/index.php.
Virginia Cooperative Extension materials are available for public use, reprint, or citation without further permission, provided the use includes credit to the author and to Virginia Cooperative Extension, Virginia Tech, and Virginia State University.
Virginia Cooperative Extension is a partnership of Virginia Tech, Virginia State University, the U.S. Department of Agriculture (USDA), and local governments, and is an equal opportunity employer. For the full non-discrimination statement, please visit ext.vt.edu/accessibility.
Publication Date
February 8, 2021
