The Economic and Fiscal Impacts of Agritourism
ID
AAEC-157NP
PREFACE AND ACKNOWLEDGMENTS
This Virginia Agritourism fiscal impact study is a multi-agency and county partnership:
Funded by The Governor's Agriculture and Forestry Industries Development (AFID) Fund through the Virginia Department of Agriculture and Consumer Services
Supported financially by the Virginia Tourism Corporation and the Counties of Augusta, Halifax, Loudoun and Rockingham
Managed by the New River Valley Regional Commission
Coordinated by Virginia Cooperative Extension
Supported by the State Agritourism Study Committee:
• George Anas, Rockingham County
• Thomas Blackwell, Essex County; Virginia Commissioner of the Revenue Association (VACOMREV); Virginia Association of Assessing Officers (VAAO)
• Kimley Blanks, Halifax County
• Lisa Bleakley, Montgomery County Tourism Director
• Michelle Bridges, Rockingham County
• Kevin Byrd, New River Regional Commission
• Esra Calvert, Virginia Tourism Corporation – Project Coordinator
• Rebekah Castle, Augusta County
• Chris Cook, Virginia Farm Bureau – Virginia FAIRS
• Joell Eifert, Ph.D., Virginia Tech
• Katie Fraizer, Virginia Agribusiness Council
• Mary Garris, Virginia Association of Assessing Officers and Value Liaison
• Amanda Glover, Augusta County
• Gordon Groover, Ph.D., Virginia Tech
• Amy Hager, The Bed & Breakfast Association of Virginia
• Leanne Harrow, Virginia Department of Agriculture and Consumer Services
• Katie Hellebush, Alliance Group – Virginia Wine Council
• Kellie Hinkle, Loudoun County
• Mike Jonas, Farm Credit of the Virginias
• Larry Land, Virginia Association of Counties
• Bruce Lowe, Virginia Association of Assessing Officers
• Matt Lohr, Farm Credit of the Virginias
• Vincent Magnini, Ph.D., Virginia Tech
• Kasey Martin, Ph.D., USDA Rural Development
• Kim Morgan, Ph.D., Virginia Tech
• Ashley Nauta, Virginia Cooperative Extension
• Jim Pease, Ph.D., Virginia Tech
• Bonnie Riedesel, Fields of Gold
• Kelli Scott, Virginia Cooperative Extension
• Eli Sharp, New River Valley Regional Commission
• Sandra Tanner, Virginia Tourism Corporation
• Stephen Versen, Virginia Department of Agriculture and Consumer Services
• Martha A. Walker, Ph.D., Virginia Cooperative Extension – Project Coordinator
• Heather Wheeler, Virginia Department of Agriculture and Consumer Services
Completing this study would not have been possible without the many individuals who replied to the agritourism inventory request, completed the farm business survey, or responded to the consumer spending survey.
Third party expert review of this study conducted by Dr. Muzzo Uysal, Department Chair and Professor, University of Massachusetts – Amherst (see bio at end of report).
EXECUTIVE SUMMARY
The Code of Virginia defines agritourism as:
“Any activity carried out on a farm or ranch that allows members of the general public, for recreational, entertainment, or educational purposes, to view or enjoy rural activities, including farming, wineries, ranching, historical, cultural, harvest-your-own activities, or natural activities and attractions. An activity is an agritourism activity whether or not the participant paid to participate in the activity.” (Code of Virginia § 3.2-6400).
In accord with the above state code, this study finds that Virginia’s agritourism sector makes substantial contributions to the economic health and well-being of the Commonwealth. A summary of key findings are as follows:1
1 Within the context of this study, the terms “establishments,” “farm businesses,” and “venues” can be used interchangeably to refer to individual entities that classify into the agritourism sector according to Virginia state code.
There are approximately 1,400 establishments in Virginia that classify into the agritourism sector. Roughly 56% of these venues are open to the public throughout the year.
While visitation levels vary widely among venues, on average 5,356 visitors patronize each establishment per year.
In 2015 visitors to Virginia’s agritourism farm businesses spent an estimated $1.5B throughout the state. Approximately, 17% of this total was spent at the agritourism venues; the remaining 83% was spent outside the venues (e.g. hotels, restaurants), but inside the Commonwealth.
The total economic activity stimulated by Virginia’s agritourism sector during 2015 was approximately $2.2B.
Economic activity created by the agritourism sector was associated with approximately $1.2B in value-added effects in 2015 which is a measure of the sector’s contribution to the gross domestic product of the state.
Regarding employment, the economic activity attributed to Virginia’s agritourism sector supported approximately 22,151 full-time equivalent jobs in the state in 2015.
In terms of wages and income, the economic activity spawned by Virginia’s agritourism sector was responsible for roughly $839.1M in wage and salary income in 2015.
Economic activity stimulated by Virginia’s agritourism sector generated approximately $134.7M in state and local tax revenues during 2015.
The economic impact from tourists [defined as those traveling 50 miles or more (one way) to an agritourism venue] was approximately $1.0B during 2015. This economic impact from tourists represents the ‘fresh money’ infused into an area economy and is a subset of the total economic activity attributed to agritourism venues.
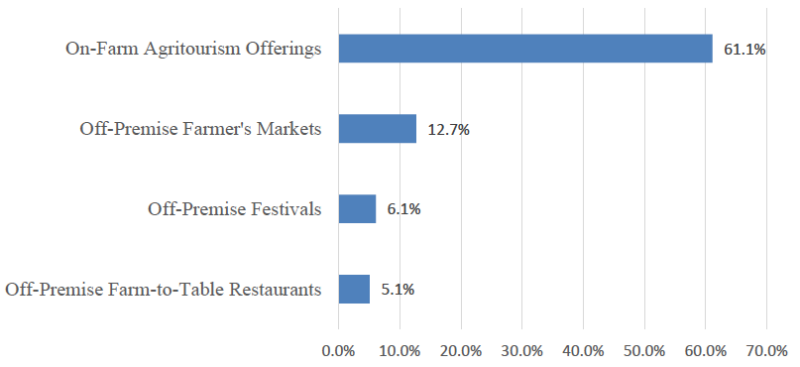
When agritourism farm business revenues deriving from off-farm markets, off-farm restaurants, and off-farm festivals are also included in the economic modeling, the amount of economic activity produced by Virginia’s agritourism sector increases by approximately 40% to a total of $3.0B.
The top motivations for Virginia’s farm businesses to operate in the agritourism sector are to:
#1: Generate additional income
#2: Market farm products
#3: Share a lifestyle or way of living with others
- The following six factors appear to be weighted equally in attracting visitors to Virginia’s agritourism venues:
• Bonding with family or friends
• Educational / experiencing something new
• Enjoying the outdoors
• Fun / entertainment
• Live close by / passing through / visiting friends or family in the area
• Purchasing good food, beer, cider, and / or wine
1. INTRODUCTION
For centuries, farms have been welcoming visitors from the general public in many parts of Europe and Asia (Bernardo, Valentin, and Leatherman, 2004). In recent years the practice of agritourism – combining agriculture and tourism on the farm – has been growing in popularity throughout the United States as well. A combination of factors is triggering the growth of the sector. For example, it is increasingly difficult for small farms to be profitable through the production of commodities; thus, the additional revenue streams deriving from agritourism offerings can be useful to farm business owners and operators. In addition, the growth of the agritourism sector is typically viewed as appealing to agencies and governments. That is, differing from a manufacturing facility for which communities often compete to attract, agritourism is a sector in which communities often benefit from working collaboratively (Lucha, Ferreira, Walker, and Groover, 2014).
Several studies and reports have been published in recent years which indicate that Virginia’s agritourism sector is healthy and growing. For example, Lucha et al. (2014) conducted a geographic analysis of agritourism in Virginia that was useful in identifying the key drivers of the industry’s success in various regions of the state. Two years earlier, Chmura Economics and Analytics produced an economic impact report covering agritourism in the Fields of Gold Region in the Shenandoah Valley (Chmura, 2012). Despite the merits of these previous studies, the Commonwealth of Virginia lacks a comprehensive assessment of the fiscal and economic impacts of the state’s agritourism sector.
Therefore, the purpose of this current study is to build upon the information contained in these earlier reports to be the first to assess the fiscal and economic impacts of Virginia’s agritourism sector, as defined by state code, from both a region-by-region and statewide perspective. As such, specific objectives of this study seek to address the following:
Estimated on-farm spending by visitors to agritourism venues
Estimated spending by visitors to agritourism venues in other sectors of the economy (off-farm spending)
The amount of economic activity stimulated by the on-farm and off-farm spending (direct, indirect, induced)
Amount of tax revenue generated by agritourism statewide and by region
Number of jobs attributed to agritourism statewide and by region (direct, indirect, induced)
Amount of labor income generated by agritourism statewide and by region
The value-added effects of agritourism statewide and by region
Top motivations of tourists to engage in Virginia’s agritourism activities
Top motivations of Virginia agritourism providers to operate in the sector
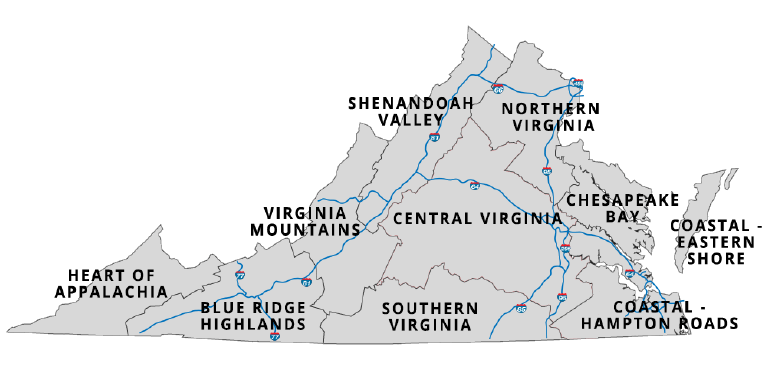
To fulfill the above objectives, the next section of this report describes the research procedures employed in this study. Subsequently, the study’s findings are presented. The report ends with a brief conclusion section that summarizes key findings and also details some of the limitations of the modeling. It is prudent to note in this introduction section that a glossary of economic impact terminology is included in Appendix A of this report. Lastly, because a number of the stated research objectives entail presenting results by region, Figure 1 offers a map of Virginia’s regions. The list of cities and counties that comprise each region, as well as regional population estimates, are found in Appendix B.
2. METHODOLOGY
2.1. Farm Business Inventory
This study adheres to the definition of agritourism as defined by the code of Virginia:
“Any activity carried out on a farm or ranch that allows members of the general public, for recreational, entertainment, or educational purposes, to view or enjoy rural activities, including farming, wineries, ranching, historical, cultural, harvest-your-own activities, or natural activities and attractions. An activity is an agritourism activity whether or not the participant paid to participate in the activity.” (Code of Virginia § 3.2-6400).
Therefore, the first stage in calculating the fiscal impact of the agritourism sector in the Commonwealth was to identify the farm businesses that comprise the sector in accord with the state code. The following steps detail how the process occurred:
Step #1:
An existing list developed by the Virginia Cooperative Extension Agency was provided to the research team. This list was used as the starting point for the inventory process.
Step #2:
Through the use of Internet-based searching, the research team expanded and refined the initial inventory list.
Step #3:
The expanded inventory list that resulted from Step #2 was sent via e-mail (see Appendix C) to this project’s advisory committee, to all of the destination marketing offices in the Commonwealth, to Virginia’s network of agriculture extension agents, to various Virginia Tourism Corporation (VTC) agents, and to relevant association managers that are involved in the State’s agritourism industry. The recipients of these e-mails were asked to kindly review the inventory on record for their respective areas and to then enter any additions / edits into a secure Qualtrics surveying site hosted by Virginia Tech. A total of 116 individuals recorded entries on the Qualtrics site and an additional 25-30 people instead opted to send their additions / edits of the inventory list via e-mail to the research team.
Step #4:
The research team purified the inventory entries received by removing redundancies and locating available contact information for the farm businesses submitted. This four-step process yielded an inventory list of farm businesses in Virginia that can be classified into the agritourism sector in accord with Virginia State Code § 3.2-6400.2
2 In the farm business surveying stage of this project, approximately 6 to 8 percent of these businesses reported that they do not host the public on their properties and cannot be included in the agritourism inventory. Although steps 1-4 in this inventorying process were as comprehensive as feasibly possible, there was no way of locating 100 percent of the agritourism providers in the state in our inventory. Therefore, it is reasonable to posit that the 6 to 8 percent that were erroneously listed in the inventory are off-set by those that were likely excluded in the inventory process.
2.2. Farm Business Data
Using the Virginia Agritourism inventory list, a brief electronic survey was sent to the farm businesses. The overarching purpose of the survey was to gather key data needed as inputs in the economic modeling; namely:
Estimated number of visitors;
Estimated percentage of visitors who traveled more than 50 miles (one way) to visit; and
Approximate amounts of any labor related expenses, operating expenses (other than labor), or capital improvement expenses that were not supported by visitor spending.
In addition to key data needed to conduct the economic modeling, the farm business survey also captured information such as whether the venues are open year-round versus seasonally; types of on-farm activities offered; motivations for operating in the sector; and perceptions of how spending and revenues are trending year-to-year.
A total of 297 farm businesses completed the survey which accounts for 21% of Virginia’s inventory. This sample size more than doubles what is required to be generalizable of the Commonwealth’s agritourism sector. Armstrong and Overton’s (1977) method of comparing early to late responses was used as an additional check to confirm that the collected responses are reflective of the sector. All diagnostics confirmed sample adequacy.
2.3. Consumer Data
An online consumer panel of respondents was enlisted to respond an electronic consumer survey designated for those who visited one or more of Virginia’s agritourism venues within the past two years. The overarching purpose of the survey was to build spending profiles of the visitors. Because previous studies (e.g. Jensen, Lindborg, English, and Menard 2006) indicate that visitors to wineries, vineyards, breweries, and distilleries (WVBD) might have larger spending profiles than visitors to other types of agritourism venues, spending profiles were built for four segments in this study:
- Local visitors to agritourism venues (non-WVBD)
- Non-local visitors to agritourism venues (non-WVBD)
- Local visitors to wineries, vineyards, breweries, and distilleries (WVBD)
- Non-local visitors to wineries, vineyards, breweries, and distilleries (WVBD)
In addition to spending profiles necessary for the economic modeling, the consumer survey also captured information such as frequency of visits, motivations for visits, and demographics.
A total of 1,203 consumers completed the survey.3 Because such a large sample was collected, only the spending information from those visiting within the past 12 months was used for building the profiles. Reducing the consumer memory window from a maximum of 24 months to a maximum of 12 months increases the accuracy of the profiles. The sample sizes of the four profiling groups ranged between 141 and 257 which far exceed the benchmark of 50 recommended by Stynes et al. (2000). It is important to note that the term ‘agritourism’ was not used on the survey, but instead respondents were screened for participation using the list of activities contained in Appendix C of this report because not all consumers are familiar with the term ‘agritourism.’
3 Demographic characteristics of the respondents are listed in Appendix D.
2.4. Economic Modeling
Economic activity of Virginia’s agritourism sector stems from three sources: farm business visitor spending, the farm business’ operational spending (to the extent that it is not supported by visitor spending), and farm business capital investment (again, to the extent that it is not supported by visitor spending). In terms of visitor spending, as explained in section 2.3 of this report, through surveying, this study developed spending profiles for local visitors to farm businesses (other than wineries, vineyards, breweries, and distilleries); non-local visitors to farm businesses (other than wineries, vineyards, breweries, and distilleries); local visitors to farm-based wineries, vineyards, breweries, and distilleries; and, non-local visitors to farm-based wineries, vineyards, breweries, and distilleries. Farm business operational and capital spending amounts, beyond what was supported by visitor spending, were gauged in the farm business survey (described in section 2.2 of this report).
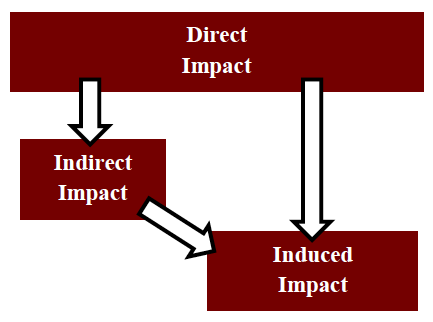
In addition to assessing the direct effects of visitor spending, this study also models secondary or ripple effects which comprise economic activity from subsequent rounds of re-spending of money. As shown in Figure 2, there are two types of ripple effects: indirect and induced. Indirect effects entail the changes in sales, income and jobs of suppliers to the farm businesses (Stynes et al., 2000). Induced effects encapsulate the changes in economic activity in the region stimulated by household spending of income earned through direct and indirect effects of agritourism-related monies.
Indirect and induced effects are estimated using economic multipliers. Multipliers reflect the extent of interdependency between sectors in a region’s economy and can vary significantly between regions and sectors (Stynes et al., 2000). Here is a simple example of how a multiplier can be interpreted: if the multiplier for the restaurant sector in a given region is 1.27 then it can be estimated that every dollar spent at a restaurant results in 27 cents of secondary economic activity in the region. Economic multipliers for the State of Virginia are commercially available in an economic impact estimation software titled IMPLAN commercialized by MIG, Inc. Therefore, the most recent IMPLAN multipliers were purchased and used in this study to calculate indirect and induced economic impacts. Used by more than 1,000 entities, IMPLAN is said to be the most widely adopted regional economic analysis software in the industry for estimating economic ripple effects (Dougherty, 2011).
In the input-output modeling for this study, economic activity describes the modeling that includes all visitor spending and consequent multiplier effects by both locals and non-locals as well as any money spent by agritourism farm businesses that was not supported by visitor spending. Consequently, economic activity figures represent all of the economic activity stimulated by the farm business within the state. As will be seen in the subsequent section of this report, economic activity is reported as a range with a high and low end to account for differing levels of economic strength between various regions in the state. More specifically, one end of the range represents adjusted economic activity which calibrates output figures based upon whether a given farm business county has economic activity above or below the state average. The other end of the range represents unadjusted economic activity which are the output figures computed using statewide IMPLAN multipliers.
In the modeling, economic impact from tourists represents the modeling that includes all visitor spending and consequent multiplier effects by those who traveled 50 miles or more (one way) to visit the agritourism venue. Thus, economic impact from tourist figures reflect all of the “fresh money” entering an economy as a result of a given farm business. In the next section of this report, economic impact from tourists is reported as a range to account for adjusted and unadjusted figures. Adjusted economic impact from tourists are the calibrated figures based upon whether a given farm business’ county has economic activity above or below the state average. Adjusted economic impact figures are also reduced by 20% to account for spending by visitors who would have traveled and spent money in the state regardless of whether the agritourism venue existed. Unadjusted economic impact from tourists are the output figures computed using statewide IMPLAN multipliers. Also, unadjusted figures do not deduct spending by visitors who report that the agritourism venue was not their primary destination.
3. FINDINGS
This section of the report contains the results of the surveying and subsequent economic modeling. First, descriptive characteristics of the sector are presented. Second, statewide economic and fiscal results are reported. Third, regional economic modeling outputs are detailed. Next, indicators of future sector success are outlined. Lastly, the key motivations for farm businesses and consumers to transact in this industry are discussed. The glossary contained in Appendix A offers definitions of key terms used in this findings section.
3.1. Descriptive Characteristics of the Sector
The inventorying process conducted in this study finds that there are approximately 1,400 agritourism venues statewide. Table 1 allocates this inventory per region (map previously presented in Figure 1). Because visitors to wineries, vineyards, breweries, and distilleries (WVBD) have different spending profiles than visitors to other types of agritourism venues, the inventory for each category is listed separately.
As seen in Table 1, of Virginia’s ten tourism regions, the highest concentration of venues is in Northern Virginia which records an estimated 353 venues. The second highest number of venues can be found in Central Virginia with an estimated 287 agritourism establishments. The third highest concentration of venues is in the Shenandoah Valley Region with an estimated 237 venues.
| VIRGINIA REGION | FARM-BASED WINERIES, VINEYARDS, BREWERIES, & DISTILLERIES (AKA: WVBD) |
AGRITOURISM VENUES (OTHER THAN WVBD) |
|---|---|---|
| Blue Ridge Highlands | 24 | 87 |
| Central Virginia | 84 | 203 |
| Chesapeake Bay | 12 | 24 |
| Coastal – Eastern Shore | 1 | 29 |
| Coastal – Hampton Roads | 19 | 113 |
| Heart of Appalachia | 3 | 15 |
| Northern Virginia | 109 | 244 |
| Shenandoah Valley | 40 | 197 |
| Southern Virginia | 17 | 70 |
| Virginia Mountains | 24 | 94 |
While visitation levels vary widely among establishments, on average 5,356 visitors patronage each establishment per year.4 Of these visitors, an estimated 42% are non-local [travel more than 50 miles (one-way) to visit the venues]. In terms of spending, on average, non-local visitors to agritourism establishments (other than WVBD) spend $34.74 at the farm business; whereas, local visitors to farm businesses (other than WVBD) spend an estimated $21.65 per visit. On the other hand, visitors to wineries, vineyards, breweries, and vineyards (WVBD) spend more on average: non-local = $45.52 per visit; local = $24.88 per visit.5
4 Mean substitutions of the outliers were used when calculating attendance. Without mean substitutions for outliers, the average attendance was 8,848 per venue which was determined to be high given that median = 1,000.
5 Mean substitutions for outliers were used when computing spending profiles. In addition, 30 percent of reported spending on lodging and restaurants was transferred from on-farm to off-farm categories to align spending profiles with previous studies [this adjustment was also made because the lay-out of the online survey may have caused some respondents to report off-farm spending in the on-farm category].
…more than one-third of agritourism establishments in Virginia have been in operation for five years or less which is testament to the recent growth of the sector.
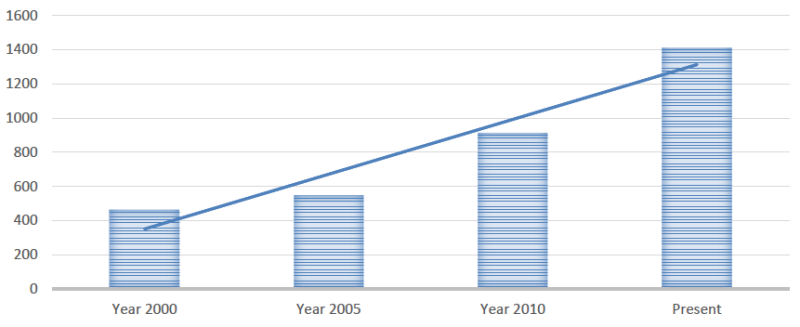
With regard to operational characteristics of venues, the average length of time that they have been open to the public is 14 years. This statistic is evidence of the relatively young nature of the industry in Virginia. Interestingly, more than one-third (35%) of the establishments have been in operation for five years or less which is testament to the recent growth of the sector. In fact, as depicted in Figure 3, the time frame with the most accelerated growth is from 2010 to present.
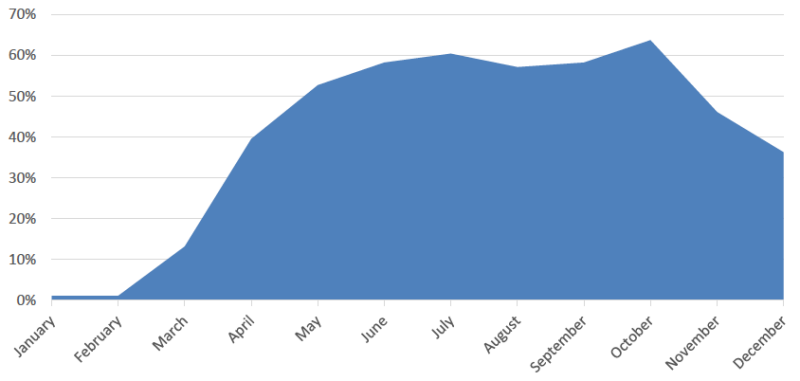
As to be expected with any nature-based offering, the industry is seasonal: approximately 44% of Virginia’s agritourism operations do not open year-round. Of those establishments that only are open seasonally, Figure 4 shows the months of the year that they operate for business. As depicted in Figure 4, October is the month with the highest number in operation. In October, many harvested items are still available; the weather is often comfortable for outdoor activities; fall foliage is peaking; and, the popularity of pumpkin festivals is partly responsible for this spike as well. Also seen in Figure 4, December remains strong in comparison to January and February due largely to the many successful Christmas tree farms in the Commonwealth. Virginia recently ranked #9 in the country with regard to the number of Christmas tree farms in operation and #6 in the U.S. in terms of tree production and acreage (http://www.virginiachristmastrees.org/).
As seen in Table 2, many farm businesses around the Commonwealth have honed-in on profitable and sought-after offerings. The #1 most commonly appearing item, tours and field trips, may not be immediately profitable, but can serve to raise interest in and awareness of an establishment leading to repeat patronage and positive word-of-mouth communications. Other interesting findings reported in Table 2 are that more than one-third of farm businesses host some sort of festival / event; about one-third offer settings for social gatherings; and approximately one-quarter deliver or support educational workshops.
| ON-FARM ACTIVITIES | % OF VENUES OFFERING |
|---|---|
| Tour / field trip | 52.7% |
| Festival / event | 38.2% |
| Wedding / reunion / social gathering / concert | 34.5% |
| Retail goods purchased on the farm | 32.4% |
| Beer, cider, spirits, or wine tasting | 26.4% |
| Educational workshop | 24.3% |
| Produce, meat, dairy, or honey purchased on the farm | 23.7% |
| Animal observation / petting | 23.3% |
| On-farm lodging or camping | 17.6% |
| Hayride | 15.2% |
| Food tasting | 14.5% |
| Farm immersion experience | 14.2% |
| U-pick vegetables or fruit | 13.9% |
| Art / painting experience | 13.2% |
| On-farm dining | 13.2% |
| Christmas tree farm / cut your own | 10.8% |
| On-farm stargazing | 10.8% |
| Pumpkin patch | 10.5% |
| On-farm horseback riding | 8.5% |
| On-farm hiking | 8.1% |
| Cooking class | 7.8% |
| On-farm fishing | 7.1% |
| Youth camp | 6.8% |
| Wildlife study | 6.4% |
| Corn maze | 5.1% |
While the term ‘agritourism’ may conjure up the traditional image of U-Pick establishments in the minds of many, such operations only account for less than one-fifth of Virginia’s agritourism inventory. While Virginia has many well-respected and successful U-Pick farm businesses, this is an important point to make because it demonstrates the diversity of the sector in the Commonwealth. In other words, the agritourism sector in Virginia is composed of a highly diversified mixture of establishments of many forms with varied offerings.
3.2. Statewide Economic and Fiscal Results
Statewide fiscal results show that the agritourism sector accounts for $2.2B in economic activity around the Commonwealth (see Table 3). As detailed in the glossary (Appendix A), this economic activity includes consumers’ spending both on and off the farm as well as subsequent ripple effects of the money. Furthermore, this economic activity encompasses the spending by farm businesses that is not supported by visitor revenues at the farms. Specifically, this study found that approximately $428K in personnel expenses, $8.0M in operating expenses (non-personnel related), and $378K in capital improvement expenses were incurred by farm businesses around the state in excess of the revenues that they generated from their agritourism operations. This spending by the farm businesses was included in the input-output modeling to estimate economic activity because the money was spent to support agritourism offerings.
| EFFECT TYPE | ECONOMIC ACTIVITY (RANGE)a | ECONOMIC ACTIVITY (MEAN)b | ECONOMIC IMPACT FROM TOURISTS (RANGE)c | ECONOMIC IMPACT FROM TOURISTS (MEAN)d |
|---|---|---|---|---|
| Direct | $1.2B → SAME | $1.2B | $506.2M → $632.8M |
$569.5 |
| Indirect | $480M → SAME |
$480M | $206.3M → $257.9M |
$232.1 |
| Induced | $498M → SAME |
$498M | $210.7M → $263.4M |
$237.1 |
| TOTAL OUTPUT | $2.2B → SAME | $2.2B | $923.3M → $1.2B | $1.0B |
STATE AND LOCAL TAX REVENUES: $134.7M
a. Range in economic activity can be attributed to differing levels of economic strength throughout the Commonwealth. On a statewide-level, however, the range is ‘zero’ because statewide multipliers are used to calculate the model.
b. The mean economic activity is the high and low end of the range summed and divided by two.
c. Range in economic impact from tourists on a statewide-level represents a 20% deduction to account for tourists whose visits to an agritourism venue was not their primary motivation for their trip.
d. The mean economic impact from tourists is the high and low end of the range summed and divided by two.
In addition, Table 3 also reports the statewide economic impact from tourists stimulated by the agritourism sector. This economic impact from tourists is the subset of the total economic activity figure generated by those who traveled more than 50 miles (one-way) to visit an agritourism venue. This economic impact from tourists is estimated at $1.0B and is important economically because it represents the ‘fresh money’ that likely would not have entered an area’s economy if not for the existence of the agritourism venue. It can be argued that this ‘fresh money’ infused by tourists is useful to any of Virginia’s regions, but it particularly beneficial to regions with low levels of economic prosperity. As a consequence, later in this report (in section 3.3), this economic impact from tourists is presented region-by-region.
… economic impact from tourists is estimated at $1.0B and is important economically because it represents the ‘fresh money’ that likely would not have entered an area’s economy if not for the existence of the agritourism venue.
According to this study’s input-output modeling, the state and local tax revenues generated by the economic activity associated with Virginia’s agritourism sector is estimated at $134.7M for 2015 (as listed in Table 3). Like described above, while tax revenues are useful to any region of the state, they are of particular value in areas with low levels of economic prosperity. Therefore, later in this report (in section 3.3), state and local tax revenues are detailed region-by-region.
Drilling-down further in this study’s results, consumers’ on-farm and off-farm spending can be separated. This segregation of spending data allows for an enhanced view of the relative fiscal effects of the agritourism industry on other state economic sectors. First, regarding on-farm spending, Table 4 divides consumer spending according to local versus non-local visitors and according to WVBD versus non-WVBD. For both WVBD and non-WVBD, non-local consumers account for larger portions of venue revenues than do local consumers. As detailed earlier in this report, while non-locals constitute, on average, 42% of visitation, they typically spend more per visit than do locals.
Hence, as seen in Table 4, non-local visitors spent an estimated $34.1M when visiting Virginia’s on-farm wineries, vineyards, breweries, and distilleries (WVBD) during 2015. As explained in section 3.1, the average expenditure per person for this segment was $45.52 at the venue. Local visitors to on-farm wineries, vineyards, breweries, and distilleries (WVBD) spent an estimated $25.7M at the establishments (average per person on-site expenditure = $24.88).
With regard to non-WVBD venues, non-local visitors spent roughly $84.1M during 2015 with the average on-site expenditure per person for this segment at $34.74. Local visitors to non-WVBD venues spent an estimated $72.4M at the establishments (average per person on-farm expenditure = $21.65).
| FARM PATRON SEGMENT | ON-FARM SPENDING AMOUNT |
|---|---|
| Local Visitors to Farm Businesses (excluding wineries, vineyards, breweries or distilleries) | $72.4M |
| Non-Local Visitors to Farm Businesses (excluding wineries, vineyards, breweries or distilleries) | $84.1M |
| Local Visitors to On-Farm Wineries, Vineyards, Breweries or Distilleries | $25.7M |
| Non-Local Visitors to On-Farm Wineries, Vineyards, Breweries or Distilleries | $34.1M |
In terms of off-farm spending, Table 5 ranks the top ten off-farm spending categories. Visitors to agritourism venues spent an estimated $225.2M in hotels/motels around the state in 2015 (see Table 5). They also spent nearly one-quarter of a billion dollars in off-farm foodservice establishments ($223.6M). While in the Commonwealth, many engaged in off-farm entertainment activities including various types of attractions, museums, and sporting events. The sizes of each of the ten categories listed in Table 5 serve as testament to the ability of the agritourism sector to help strengthen other economic sectors.
| SPENDING CATEGORY | OFF-FARM SPENDING AMOUNT |
|---|---|
| Hotels / Motels | $225.2M |
| Restaurants, fast food, bar (including off-farm breweries and distilleries) | $223.6M |
| Entertainment (e.g. off-farm sporting activities and attractions) | $214.3M |
| Groceries and convenience items (including off-premise farmer’s markets) | $149.5M |
| Transportation expenses other than gasoline | $146.2M |
| Gasoline | $109.4M |
| Souvenirs | $97.4M |
| Clothing | $60.0M |
| Camping fees and charges | $41.0M |
| Sporting equipment | $40.8M |
Evidently, job creation is a major emphasis of economic development offices around the state, particularly following the great recession of 2008-2009. As such, agritourism is a key ingredient in the New Virginia Economy because both tourism and agriculture are named as target industry sectors in the new economy (https://commerce.virginia.gov/media/3501/new-virginia-economy-12052014.pdf). As seen in Table 6, the economic activity spawned by Virginia’s agritourism sector supports just over 22,000 full-time equivalent jobs in the state. This figure includes direct effects and secondary effects of job creation due to income to suppliers or due to spending resulting from increased household income. Total labor income associated with these jobs is $839.1M. Notably, economic activity created by the agritourism sector was associated with approximately $1.2B in value-added effects which is a measure of the sector’s contribution to the gross domestic product of the Commonwealth.
… the economic activity spawned by Virginia’s agritourism sector supports just over 22,000 full-time equivalent jobs in the state.
| EFFECT TYPE | EMPLOYMENT: FULL-TIME EQUIVALENT JOBS (FTES)a | LABOR INCOME | TOTAL VALUE-ADDED |
|---|---|---|---|
| Direct Effect | 16,386 | $521.8M | $671.3M |
| Indirect Effect | 2,585 | $155.1M | $283.9M |
| Induced Effect | 3,179 | $162.2M | $293.7M |
| Total Effect | 22,151 | $839.1M | $1.2B |
a. Full-time equivalent (FTE) jobs are defined as total hours worked divided by average annual hours worked in full-time jobs.
3.3. Regional Economic and Fiscal Results
Region-by-region findings are reported in this section of the report. Table 7 displays an alphabetical listing of Virginia regions along with estimations of how many visitors their venues hosted in 2015. When interpreting the figures in this Table it is prudent to note that non-local visitors are particularly useful in economic modeling because they introduce ‘fresh money’ into an area’s economy.
| VIRGINIA REGION | LOCAL VISITORS | NON-LOCAL VISITORS | TOTAL VISITOR SPENDING |
|---|---|---|---|
| Blue Ridge Highlands | 344,819 | 249,697 | $120.0M |
| Central Virginia | 891,560 | 645,612 | $311.3M |
| Chesapeake Bay | 111,833 | 80,983 | $39.1M |
| Coastal – Eastern Shore | 93,194 | 67,486 | $32.2M |
| Coastal – Hampton Roads | 410,055 | 296,937 | $142.4M |
| Heart of Appalachia | 55,917 | 40,491 | $19.4M |
| Northern Virginia | 1,096,587 | 794,081 | $383.1M |
| Shenandoah Valley | 736,236 | 533,136 | $255.8M |
| Southern Virginia | 270,264 | 195,708 | $94.0M |
| Virginia Mountains | 366,565 | 265,443 | $127.5M |
| TOTALS: | 4.3M | 3.2M | $1.5B |
“Agritourism is a fast growing and important part of the new Virginia economy, injecting millions of dollars into rural and suburban communities across the Commonwealth.”
Todd Haymore, Secretary of Commerce and Trade
Business and community leaders in various geographic areas can employ the values in the final column of Table 7 as a metric of the importance of their region’s agritourism sector to the state’s economy. For example, it can be stated that agritourism venues in the Blue Ridge Highlands region are responsible for an estimated $120.0M in consumer spending in the Commonwealth (this includes on-farm and off-farm spending).
Next, in terms of economic activity, Table 8 presents regional results. The case of the Central Virginia region can be used to illustrate how these figures can be interpreted: In the case of the Central Virginia region, the $311.3M of consumer spending (previously reported in Table 7), generates roughly $440.0M in economic activity in the state when multiplier effects are modeled. It is prudent to note that the $440.0M also includes spending by venues that was not supported by visitor revenues [In the case of Central Virginia this was estimated at $737K]. As seen in Table 8, the agritourism sector in the Northern Virginia region produces the most economic activity due to the sheer number of venues in the region and due to the economic strength of the area. More detailed information about the monetary adjustments made in Table 8 due to regional economic factors can be found in Appendix E.
| VIRGINIA REGION | TOTAL ECONOMIC ACTIVITY (RANGE)a | TOTAL ECONOMIC ACTIVITY (MEAN)b |
|---|---|---|
| Blue Ridge Highlands | $156.4M → 170.0M | $163.1M |
| Central Virginia | $440.0M → SAME | $440.0M |
| Chesapeake Bay | $53.0M → 55.2M | $54.1M |
| Coastal – Eastern Shore | $42.1M → $45.8M | $44.0M |
| Coastal – Hampton Roads | $201.9M → SAME | $201.9M |
| Heart of Appalachia | $25.3M → $27.5M | $26.4M |
| Northern Virginia | $541.3M → $562.9M | $552.1M |
| Shenandoah Valley | $362.6M → SAME | $362.6M |
| Southern Virginia | $122.5M → $133.2M | $127.8M |
| Virginia Mountains | $173.4M → $180.6M | $177.0M |
a. Range in economic activity can be attributed to differing levels of economic strength throughout the state.
b. The mean economic activity is the high and low end of the range summed and divided by two.
A subset of the economic activity figures reported in the previous Table is economic impact from tourists which represents the spending and consequent ripple effects of non-local visitors (those traveling more than 50 miles one way) to visit a venue. As stated earlier in this report, economic impact from tourists constitutes the ‘fresh money’ that is infused into a community as a result of the existence of an agritourism venue. As outlined in Table 9, Northern Virginia recorded the highest economic impact from tourists, followed by Central Virginia, then by the Shenandoah Valley Region. While $12.9M of ‘fresh money’ generated by venues in the Heart of Appalachia may seem small in comparison to the $263M in Northern Virginia, ‘fresh money’ goes a long way to help communities; particularly in areas with low levels of economic prosperity.
| VIRGINIA REGION | TOTAL IMPACT FROM TOURISTS (RANGE)a |
TOTAL IMPACT FROM TOURISTS (MEAN)b |
|---|---|---|
| Blue Ridge Highlands | $67.0M → 91.1M | $79.0M |
| Central Virginia | $187.3M → $234.1M | $210.7M |
| Chesapeake Bay | $22.5M → $29.3M | $25.9M |
| Coastal – Eastern Shore | $23.0M → $25.0M | $24.0M |
| Coastal – Hampton Roads | $87.1M → $108.9M | $98.0M |
| Heart of Appalachia | $10.9M → $14.8M | $12.9M |
| Northern Virginia | $239.3M → $287.6M | $263.4M |
| Shenandoah Valley | $156.1M → $195.1M | $175.6M |
| Southern Virginia | $52.6M → $71.5M | $62.0M |
| Virginia Mountains | $74.4M → $96.9M | $85.7M |
a. Range in economic impact from tourists can be attributed to differing levels of economic strength throughout the Commonwealth as well as a 20% deduction for tourists whose visits to an agritourism venue was not their primary motivation for their trip.
b. The mean economic impact from tourists is the high and low end of the range summed and divided by two.
Jobs, labor income, and value-added results for each region are reported in Table 10. As in the previous Tables, Northern Virginia recorded the highest figures: 5,556 full-time equivalent jobs, 210.5M in labor income, and $313.3M in value-added effects. The second largest results were found in Central Virginia, followed by the Shenandoah Valley region.
TABLE 10: EMPLOYMENT, LABOR INCOME, AND VALUE-ADDED IN EACH VIRGINIA REGION
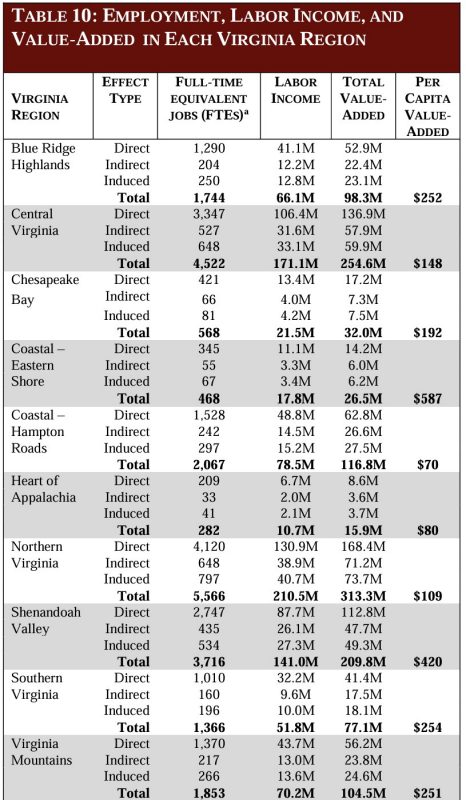
a.Full-time equivalent (FTE) jobs represent total hours worked divided by average annual hours worked in full-time jobs.
Per capita value-added effects are also reported in Table 10 so that economic results can be understood relative to regional population densities. Agritourism venues are well-suited for rural areas so long as highways deem visitation convenient as is the case along the I-81 corridor in the Shenandoah Valley which experiences a daily traffic count of approximately 54,000 vehicles per day (www.virginiadot.org/Info/resources/Traffic_2015/AADT_PrimaryInterstate_2015.pdf).6
6 A recent study conducted by Lucha, Ferreira, Walker, and Groover (2014) found that transportation infrastructure is a key determinant of farm business success in agritourism.
“Agriculture is the largest industry in Virginia, and is the backbone of our past, present, and future.”
Basil Gooden, Secretary of Agriculture
A total of $134.7M in state and local tax revenue can be attributed to the economic activity associated with agritourism on a statewide basis. Each region’s results are listed in Table 11. Agritourism businesses in Virginia are valuable to the state because they require very little support from the state, but yield substantial tax revenues. The $8.3M, for example, stemming from Southern Virginia’s agritourism activities is a solid contribution to the economy of formerly tobacco-focused farming areas.
| State | Local Taxes |
|---|---|
| Blue Ridge Highlands | $10.6M |
| Central Virginia | $27.5M |
| Chesapeake Bay | $3.5M |
| Coastal – Eastern Shore | $2.8M |
| Coastal – Hampton Roads | $12.6M |
| Heart of Appalachia | $1.7M |
| Northern Virginia | $33.8M |
| Shenandoah Valley | $22.6M |
| Southern Virginia | $8.3M |
| Virginia Mountains | $11.3M |
3.4. Indicators of Future Sector Performance
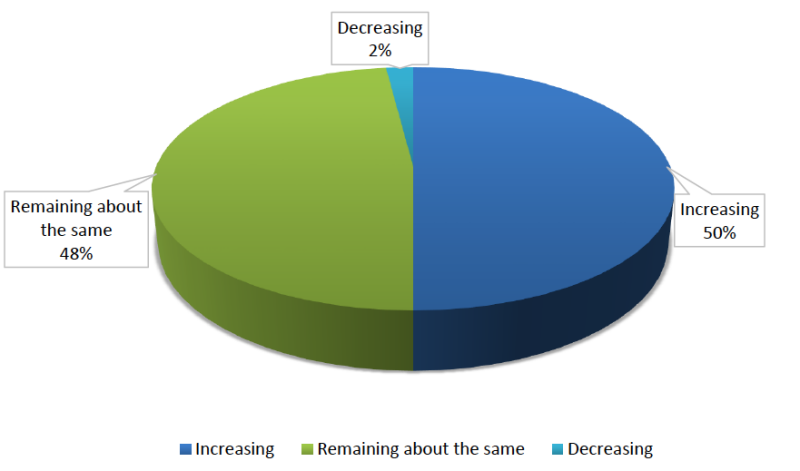
While the primary motivation of the current study is to gain a better understanding of the most recent fiscal impacts of the agritourism sector in Virginia, there were several items on the farm business survey that allow for a glimpse at future sector performance. First, the farm business survey asked the owners / managers about their perceptions of whether the spending by each visitor over the past five years is tending to increase, decrease, or remain about the same. As displayed in Figure 5, 48% perceive average spending per visitor to be remaining about the same; 50% perceive the average to be increasing; and, only 2% perceive it to be decreasing.
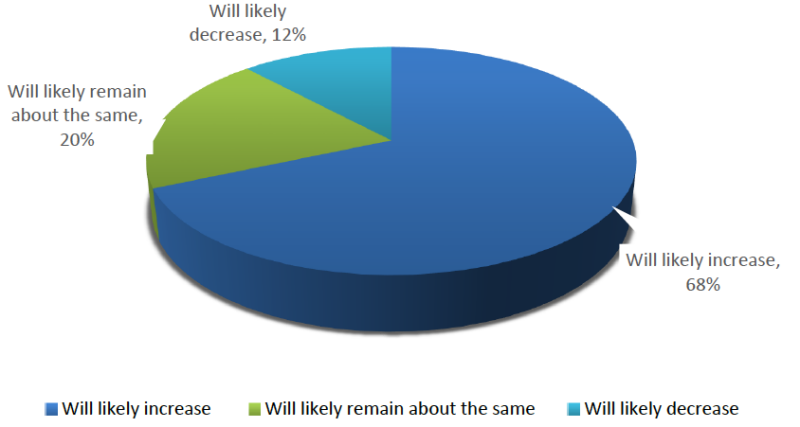
Second, the farm business survey was completed by the respondents in September 2016 at which time they were reporting their 2015 data [because 2015 was the most recent complete calendar year]. Nevertheless, with nine months almost complete in 2016 at the time of data collection, the respondents were asked to report how their 2016 year is taking shape in comparison to 2015. As seen in Figure 6, nearly 7 out of 10 (68%) indicated that their 2016 attendance figures exceed 2015 numbers. It is prudent to note that it was pointed out to the research team by a couple of respondents that for seasonal operations, rainy weekends could cause attendance figures to fluctuate from one year to the next. For instance, if an operation is open 12 weeks, a season with three rainy weekends would likely record fewer patrons than a season with one rainy weekend. Despite these fluctuations due to weather conditions, Figure 6 clearly demonstrates an upward trend in attendance from 2015 to 2016.
Another indicator of the future health of the agritourism sector is the broad and varied income levels of patrons. Agritourism venues have a wide appeal to nearly every socioeconomic group in their target markets. For example, among this study’s consumer panel, about one-third of respondents report household incomes below the state’s mean and median levels, but on the other end of the spectrum, one-quarter of respondents earn household incomes in excess of $100K. In other words, it appears that from a socioeconomic perspective, Virginia’s agritourism sector has something for everyone to enjoy. Offerings range from camping on a farm to upscale accommodations; from walks through corn mazes to high-end wedding reception venues. In other words, offerings range from high-end activities that are expensive for patrons to participate to other activities that are economically priced. Such diversity in activities, and variety in socio-economic markets served, aid in recession-proofing the industry.
… from a socioeconomic perspective, Virginia’s agritourism sector has something for everyone to enjoy.
An additional indicator of the fiscal success of the sector is the loyalty of patrons. According to the findings of this study, visitors generally appear to be loyal to Virginia’s agritourism sector. That is, approximately 61% of visitors take more than one outing or trip per year that includes a Virginia agritourism venue. Moreover, 45% visit more than one venue per outing or trip. For non-local visitors, the average trip length is 2.5 nights. The fact that more than half of patrons engage with the sector more than one per year, and nearly half frequent more than one establishment when engaging, can be viewed as a signal of the health of the sector in Virginia.
An additional indicator of the fiscal success of the sector is the loyalty of patrons. According to the findings of this study, visitors generally appear to be loyal to Virginia’s agritourism sector. That is, approximately 61% of visitors take more than one outing or trip per year that includes a Virginia agritourism venue. Moreover, 45% visit more than one venue per outing or trip. For non-local visitors, the average trip length is 2.5 nights. The fact that more than half of patrons engage with the sector more than one per year, and nearly half frequent more than one establishment when engaging, can be viewed as a signal of the health of the sector in Virginia.
3.5. Motivations of Providers and Visitors
The farm business survey asked operators about their motivations for conducting business in the agritourism sector. As seen in Table 12, the top two motivations for operating in this space are purely practical: 1) to augment farm revenue streams; and 2) to further market products produced on the farm. Evidently, in any business endeavor, the more diversified the revenue streams and target markets, the less vulnerability to hindrances that might emerge in the business environment.
| Rank | Motivations |
|---|---|
| #1 | For additional income |
| #2 | Market farm products |
| #3 | To share a lifestyle or way of living with others |
| #4 | To fully utilize farm resources |
| #5 | Provide service / opportunity to the community |
| #6 | Educate / teach people about farming |
| #7 | Decrease dependence on one source of income |
| #8 | Hobby; for fun; to keep active |
| #9 | For employment of family members |
| #10 | Tax incentives |
| #11 | The loss of government agricultural programs |
… many farm businesses are anchored in part by the motivation of the owners/ operators to share their lifestyles with others.
Interestingly however, three of the top six motivations for operating in the sector are not underpinned by financial objectives, but rather by social / goodwill purposes. More specifically, many farm businesses are anchored in part by the motivation of the owners/ operators to share their lifestyles with others; to provide service to their communities; and, to educate others about farming. These noble motivations are engrained into the very fabric of the Commonwealth of Virginia in which the history of tending to crops extends back to early Colonial times when the first settlers were taught by Native Americans how to reap the benefits of our rich and fertile soil. It can be argued that sustaining these traditions is an integral facet of our culture as Virginians.
Interestingly however, three of the top six motivations for operating in the sector are not underpinned by financial objectives, but rather by social / goodwill purposes. More specifically, many farm businesses are anchored in part by the motivation of the owners/ operators to share their lifestyles with others; to provide service to their communities; and, to educate others about farming. These noble motivations are engrained into the very fabric of the Commonwealth of Virginia in which the history of tending to crops extends back to early Colonial times when the first settlers were taught by Native Americans how to reap the benefits of our rich and fertile soil. It can be argued that sustaining these traditions is an integral facet of our culture as Virginians.
“Virginia is a top ten destination for travelers, largely due to the diversity of product and the authenticity of offered experiences and agriculture is a key part of that variety. From aquaculture operations along our coastlines to wineries along the slopes of our mountains, travelers in Virginia can truly immerse themselves through sight, touch, and taste of all that Virginia agriculture has to offer. These authentic, experiential moments make it easy for travelers to discover why Virginia is for Lovers.”
Todd Haymore, Secretary of Commerce and Trade
| Motivations: |
|---|
| > Availability of good food, beer, and/or wine |
| > Bonding with family and friends |
| > Educational / experiencing something new |
| > Enjoying the outdoors |
| > Fun / entertainment |
| > Live close by / passing through / visiting friends or family in the area |
4. CONCLUSIONS
The results of this economic and fiscal impact study highlight the importance of the agritourism sector to Virginia’s economy. In 2015, the economic activity associated with the sector was an estimated $2.2B with about $1B of this representing ‘fresh money’ infused into the economy by tourists. The economic activity attributed to Virginia’s agritourism sector supported approximately 22,151 full-time equivalent jobs, $839.1M in wage and salary income, and $1.2B in value-added effects. Moreover, economic activity stimulated by the sector generated approximately $134.7M in state and local tax revenue in the Commonwealth during 2015.
“Agritourism now offers farmers and purveyors an opportunity to tap into the multi-billion dollar tourism industry, which helps them to not only sustain, but also to expand their businesses. Agritourism is healthy and thriving in Virginia, and is on a trajectory to continue growing.”
Basil Gooden, Secretary of Agriculture
Not only do Virginia’s agritourism venues produce economic-related results, but they also help foster a host of other societal benefits that cannot be incorporated in econometric modeling. Many of the venues, for example, improve consumers’ access to the fresh and healthy fruits, meats, seafood, and vegetables. In addition, being that about half of Virginia’s venues host field trips and tours, it can be stated that the sector plays a key role in educating others about a variety of topics ranging from farming to food production; from wetland management to wine-making; from oyster shucking to owl calling. In summary, Virginia’s venues serve as accessible oases at which visitors can bond with family and friends while learning and enjoying nature. Moreover, given many factors such as increased demand for nature-based wedding venues; consumers’ rising interest in fresh and healthy foods; and, the increasing popularity of experiential tourism experiences, many of Virginia’s agritourism venues are well-poised for continued success.
This research represents the most comprehensive fiscal impact study of Virginia’s agritourism sector to-date. The Weldon Cooper Center for Public Service7 periodically produces well-crafted reports detailing the economic impacts of the Agriculture and Forest Industries in Virginia, but the current study is the first to focus specifically upon Virginia agritourism. According to Crompton (1993), the validity and reliability of an economic impact study depends on: 1) the accuracy of visitor spending estimates; 2) adherence of statistical rules applied in the study in particular pertaining to the use of the multiplier coefficients; and 3) reasonable attendance estimates. First, in terms of spending estimates, the sample sizes of the four profiling groups ranged between 141 and 257 which far exceed the benchmark of 50 recommended by Stynes et al. (2000). Second, regarding the multiplier coefficients, the most recent IMPLAN multipliers commercially available were utilized to perform the modeling. Third, in terms of attendance estimates, the research team employed attendance figures that were conservative because the removal of outliers in the farm business data set yielded an overall attendance figure that was 40% lower than the mean figure generated.
7 The investigator on these studies is Regional Economist, Terance Rephann, Ph.D.
…As Virginia’s agritourism sector continues to grow and to strengthen so does the state’s reputation and consequent ability to attract agritourists.
While a bright picture emerges when the economic impacts of Virginia’s agritourism sector are calculated, such a picture does not always make its way to every venue. Those who work in the sector would likely agree that their revenues are well-deserved and earned mostly through hard work. Many problems can occur when depending in part upon Mother Nature for one’s livelihood: too much rain, too little rain, a late frost, etc… As stated early in this report, approximately $428K in personnel expenses, $8.0M in operating expenses (non-personnel related), and $378K in capital improvement expenses were incurred by farm businesses around the state in excess of the revenues that they generated from their agritourism operations. Yes, it is quite possible to be profitable in the sector, but the opposite is also possible. This risk / reward balance is often underpinned by an owner / operator’s passion for the mission of his / her venue and the desire to educate others about a particular lifestyle.
As an extension of the above cautionary note, while there might be opportunities for farm businesses to capture some of the agritourist off-farm spending at their venues, operators would be well-served to consult with their local resources (e.g. extension agents) when venturing into the offering of new amenities. Dynamic regulatory environments should be understood before capital investments are made by operators. For example, the new sharing economy has caused some municipalities to amend their regulations pertaining to the offering of lodging accommodations.
The roughly 1,400 venues located in this study exceed the number of venues identified in past Virginia studies. In fact, as previously noted in this report, the time frame with the most accelerated growth is from 2010 to present [approximately one-third of Virginia’s venues have opened since 2010]. Hence, the question emerges as to whether increased competition might be a hindrance to a potential owner contemplating entering the industry. While increased competition might be a disadvantage under some circumstances [for example, if there were ten Christmas tree farms serving a market as opposed to three farms], in many situations the principle of cumulative attraction applies to agritourism clusters. The principle of cumulative attraction posits that similar businesses will often attract more customers if they are clustered together geographically than if they are dispersed (Litz and Rajaguru, 2008; Nelson, 1958; Prayag, Landre, and Ryan, 2012). In other words, proximity to similar businesses often enhances performance (Litz and Rajaguru, 2008). Following this logic, as Virginia’s agritourism sector continues to grow and to strengthen so does the state’s reputation and consequent ability to attract agritourists.
Lastly, as with the study of economic impacts in any industry or sector, the modeling inputs should be continually evaluated and refined through time because all three (spending, multipliers, and attendance) are dynamic and change in response to economic and other external conditions. Virginia’s agritourism inventory is fluid as well with new venues opening and existing ones closing. Therefore, it is recommended that this study be refreshed every two years. Because the input-output models are already constructed, refreshing the inputs is not labor intensive. Moreover, if additional data sets are collected it would become possible to segregate results by sector (e.g. winery; equestrian; Christmas tree, etc…) and by county.
INVESTIGATOR BIO
Dr. Vincent Magnini holds a Ph.D. in International Business / Marketing from Old Dominion University, an MBA from Wichita State University, and a Bachelor’s of Science in Hospitality and Tourism Management from Virginia Tech. He was recently ranked as one of the top 12 most prolific hospitality researchers worldwide and holds editorial board appointments on nearly all of the top-ranked research journals in the field. Further, he is a U.S. Fulbright Scholar. He has published six books and more than 150 articles and reports. Dr. Magnini has also been featured on National Public Radio’s (NPR) All Things Considered, With Good Reason, Pulse on the Planet and cited in the New York Times.
Dr. Magnini regularly consults for a number of constituencies in the hospitality and tourism sectors. The consulting activities include projects such as strategic marketing plans, economic impact analyses, feasibility studies, and executive education seminars.
REVIEWER BIO
Dr. Muzaffer (Muzzo) Uysal holds a Ph.D. in tourism and recreation from Texas A&M University, an MBA from the University of New Haven, and a Bachelor’s of Science in accounting and business administration from the Ankara Academy of Economics and Commercial Sciences. He has extensive experience in the travel and tourism field; has worked on several funded tourism management and marketing projects and conducted tourism workshops and seminars in more than 30 countries. He is a member of International Academy for the Study of Tourism, the Academy of Leisure Sciences, and serves as co-editor of Tourism Analysis: An Interdisciplinary Journal. He has also authored and co-authored a significant number of articles, five monographs, and eight books related to tourism research methods, tourist service satisfaction, tourism and quality-of-life, creating experience value in tourism, consumer psychology in tourism and hospitality settings.
Dr. Uysal has also received a number of awards for Research, Excellence in International Education, Teaching Excellence, and best paper awards. His current research interests center on tourism demand/supply interaction, tourism development and QOL research in tourism.
REFERENCES
Armstrong, J. S., and Overton, T. S. (1977). Estimating nonresponse bias in mail surveys. Journal of Marketing Research, 396-402.
Bernardo, D., Valentin, L., and Leatherman, J. (2004, August). Agritourism: if we build it, will they come. In Risk and Profit Conference, Manhattan, KS, 19-20.
Chmura Economics and Analytics (2012). The Economic Impact of Agritourism in Virginia’s Fields of Gold Region. Prepared for County of Augusta for the Central Shenandoah Planning District Commission.
Crompton, J. L. (1993). Economic impact analysis: Myths and misapplication. Trends, 30(4), 9-14.
Dougherty, R. (2011). 2010 Maryland State Parks Economic Impact and Visitor Study. Maryland Office of Tourism Development: Department of Business and Economic Development; in collaboration with the Maryland Department of Natural Resources; Cecil County Tourism, Office of Economic Development; Maryland Association of Destination Marketing Organizations; Governor’s State Park Advisory Commission.
https://www.census.gov/quickfacts/table/PST045216/00 (accessed: 3/14/17).
https://commerce.virginia.gov/media/3501/new-virginia-economy-12052014.pdf (accessed: 12/8/16).
http://rdc.cspdc.org (accessed: 11/20/16).
http://www.virginiachristmastrees.org/ (accessed 1/20/17).
http://www.virginiadot.org/info/resources/Traffic_2015/AADT_PrimaryInterstate_2015.pdf (accessed 12/9/16).
Jensen, K., Lindborg, C., English, B. and Menard, J. (2006). Visitors to Tennessee Agri-Tourism Attractions: Demographics, Preferences, Expenditures, & Projected Economic Impacts. Report to the Tennessee Department of Agriculture.
Litz, R. and Rajaguru, G. (2008). “Does small store location matter? A test of three classic theories of retail location.” Journal of Small Business and Entrepreneurship, Vol. 21 (4), pp. 477-492.
Lucha, C., Ferreira, G., Walker, M. and Groover, G. (2014). A Geographic Analysis of Agritourism in Virginia. Produced by Communications and Marketing, College of Agriculture and Life Sciences, Virginia Tech.
Nelson, R. (1958). The Selection of Retail Locations, Dodge: New York, NY.
Prayag, G., Landre, M., and Ryan, C. (2012). “Restaurant Location in Hamilton, New Zealand: Clustering Patterns from 1996 to 2008.
Stynes, D. J., Propst, D. B., Chang, W., and Sun, Y. (2000). Estimating national park visitor spending and economic impacts: The MGM2 model. Report to the National Park Service. East Lansing, MI: Department of Park, Recreation and Tourism Resources, Michigan State University.
APPENDIX A: GLOSSARY OF TERMS
{Many of the definitions in this glossary are paraphrased directly from Stynes et al. (2000) MGM2 user’s manual}
Direct effects – the changes in sales, income and jobs in an area as a result of first-round visitor spending and spending by agritourism farm businesses not supported by visitor revenues.
Economic impact from tourists – economic output modeling that includes all visitor spending and consequent multiplier effects by those traveling 50 miles or more to visit an agritourism site. Thus, economic impact figures reflect all of the “fresh money” entering an economy as a result of a given agritourism venue.
Unadjusted economic impact from tourists - economic impact output figures computed using statewide IMPLAN multipliers. Also, unadjusted figures do not deduct spending by visitors who report that the agritourism venue was not their primary destination.
Adjusted economic impact from tourists – calibrated economic impact output figures based upon whether a given region has economic activity above or below the state average. Adjusted economic impact figures are also reduced downward to account for spending by visitors who would have traveled and spent money in the state regardless of whether the agritourism venue existed.
Economic activity – economic output modeling that includes all visitor spending and consequent multiplier effects by both locals and non-locals as well as any money spent by agritourism businesses that was not supported by visitor spending. Consequently, economic activity figures represent all of the economic activity stimulated by an agritourism business location within the state.
Unadjusted economic activity - economic significance output figures computed using statewide IMPLAN multipliers.
Adjusted economic activity– calibrated economic significance output figures based upon whether a given agritourism venue’s county(ies) has economic activity above or below the state average.
Indirect effects – the changes in sales, income and jobs of suppliers of goods and services to those businesses where consumers spend direct money.
Induced effects – the changes in economic activity in the region stimulated by household spending of income earned through direct and indirect effects of visitor spending.
IMPLAN – a computer-based input / output economic modeling system. With IMPLAN one can estimate 528 sector input / output models for any region consisting of one or more counties. IMPLAN includes procedures for generating multipliers and estimating impacts by applying final demand changes to the model.
Multipliers – express the magnitude of the secondary effects in a given geographic area and are often in the form of a ratio of the total change in economic activity relative to the direct change. Multipliers reflect the degree of interdependency between sectors in a region’s economy and can vary substantially across regions and sectors.
Secondary effects – the changes in economic activity from subsequent rounds of re-spending of tourism dollars. There are two types of secondary effects: indirect and induced.
Value-added (also termed ‘gross regional product’) – the sum of total income and indirect business taxes. Value-added is a commonly used measure of the contribution of a region to the national economy because it avoids the double counting of intermediate sales and incorporates only the ‘value-added’ by the region to final products.
| Region | Counties | Total Populations |
|---|---|---|
| Blue Ridge Highlands | BLAND BRISTOL CITY CARROLL FLOYD GALAX CITY GILES GRAYSON MONTGOMERY PATRICK PULASKI RADFORD CITY S MYTH WASHINGTON WYTHE |
Region Population:8 389,929
8 https://www.census.gov/ |
| Central Virginia | ALBEMARLE AMELIA AMHERST APPOMATTOX BUCKINGHAM CAMPBELL CHARLOTTESVILLE CITY CHESTERFIELD COLONIAL HEIGHTS CITY CUMBERLAND DINWIDDIE FLUVANNA GOOCHLAND GREENE HANOVER HENRICO HOPEWELL CITY LOUISA LYNCHBURG CITY MADISON NELSON NOTTOWAY ORANGE PETERSBURG CITY POWHATAN PRINCE EDWARD PRINCE GEORGE RICHMOND CITY SUSSEX |
Region Population: 1,715,099 |
| Chesapeake Bay | ESSEX GLOUCESTER KING AND QUEEN KING GEORGE KING WILLIAM LANCASTER MATHEWS MIDDLESEX NORTHUMBERLAND RICHMOND WESTMORELAND |
Region Population: 166,417 |
| Coastal Virginia - Eastern Shore | ACCOMACK NORTHAMPTON |
Region Population: 45,128 |
| Coastal Virginia - Hampton Roads | CHARLES CITY CHESAPEAKE CITY FRANKLIN CITY HAMPTON CITY I SLE OF WIGHT JAMES CITY NEW KENT NEWPORT NEWS CITY NORFOLK CITY POQUOSON CITY PORTSMOUTH CITY SOUTHAMPTON SUFFOLK CITY SURRY VIRGINIA BEACH CITY WILLIAMSBURG CITY YORK |
Region Population: 1,665,850 |
| Heart of Appalachia | BUCHANAN DICKENSON LEE NORTON CITY RUSSELL SCOTT TAZEWELL WISE |
Region Population: 199,171 |
| Northern Virginia | ALEXANDRIA CITY ARLINGTON CAROLINE CULPEPER FAIRFAX FAIRFAX CITY FALLS CHURCH CITY FAUQUIER FREDERICKSBURG CITY LOUDOUN MANASSAS CITY MANASSAS PARK CITY PRINCE WILLIAM RAPPAHANNOCK SPOTSYLVANIA STAFFORD |
Region Population: 2,887,187 |
| Shenandoah Valley | AUGUSTA BUENA VISTA CITY CLARKE FREDERICK HARRISONBURG CITY LEXINGTON CITY PAGE ROCKBRIDGE ROCKINGHAM SHENANDOAH STAUNTON CITY WARREN WAYNESBORO CITY WINCHESTER CITY |
Region Population: 499,464 |
| Southern Virginia | BRUNSWICK CHARLOTTE DANVILLE CITY EMPORIA CITY GREENSVILLE HALIFAX HENRY LUNENBURG MARTINSVILLE CITY MECKLENBURG PITTSYLVANIA |
Region Population: 302,856 |
| Virginia Mountains | ALLEGHANY BATH BEDFORD BOTETOURT COVINGTON CITY CRAIG FRANKLIN HIGHLAND ROANOKE ROANOKE CITY SALEM CITY |
Region Population: 415,277 |
APPENDIX C: FARM BUSINESS INVENTORY E-MAIL
Dear XX,
Virginia's Secretary of Agriculture and Forestry, Todd Haymore, has commissioned a study on the economic impact of the Commonwealth's agritourism sector. Before the study begins, we must identify all of the agritourism businesses in the state.
If you are aware of any establishments in your area that are not in the attached excel file, but offer one or more of the items on the below list, could you please take a couple of moments to enter them here:
https://virginiatech.qualtrics.com/SE/?SID=SV_5bZ9fKvhHS6O0FT
***PLEASE COMPLETE BY AUGUST 5th
Educational experiences on a farm1, ranch, orchard, or vineyard:
Tour / Field trip
Farm immersion experience
Cooking class
Beer, cider, spirits, or wine tasting
Food tasting
Educational workshop
Wildlife study
Youth camp
Art / photography
Entertainment on a farm1, ranch, orchard, or vineyard:
Festival / event
Hayride
Haunted barn
Corn maze
Pumpkin patch
Animal observation / petting
Barn dance
Rodeo
Cook-off or contest
Wedding / reunion / social gathering / concert
Hospitality services on a farm1, ranch, orchard, or vineyard:
On-farm lodging or camping
On-farm dining
On-farm1, direct sales:
U-pick vegetables or fruit
Christmas tree farm / cut your own
Produce, meat, dairy, or honey purchased on the farm
Retail goods purchased on the farm
Outdoor recreation on a farm1, ranch, orchard, or vineyard:
On-farm fishing
On-farm hunting
On-farm horseback riding
On farm boating
On-farm bicycling / foot race / adventure course / zip line
On-farm hiking
On-farm stargazing
On-farm skeet / trap shooting
1Includes all types of farms: e.g. aquaculture farms, bee farms, green houses/nurseries, oyster farms, etc…
Respondents' Age Brackets
| Age | Percentage |
|---|---|
| 18 to 24 | 11.06% |
| 25 to 34 | 40.81% |
| 35 to 44 | 25.44% |
| 45 to 54 | 12.64% |
| 53 to 64 | 6.90% |
| 65 and over | 3.16% |
Respondents' Gender
| Gender | Percentage |
|---|---|
| Female | 63.17% |
| Male | 36.83% |
Respondents' Educational Attainment
| Educational Attainment | Percantage |
|---|---|
| Some High School | 0.67% |
| High School | 8.14% |
| Some College | 16.86% |
| Associate's Degree or Vocational | 10.15% |
| Bachelor's Degree | 31.12% |
| Some Graduate School | 5.03% |
| Graduate Degree | 15.94% |
| Prefer not to answer | 12.08% |
Respondents' Household Income
| Household Income | Percentage |
|---|---|
| Less than $55,000 | 29.8% |
| Between $55,000 - $75,000 | 24.1% |
| Between $75,000 - $100,000 | 20.5% |
| Greater than $100,000 | 25.3% |
Average party size
| Party Size |
|---|
| 2.97 individuals |
| VIRGINIA REGION | ECONOMIC ACTIVITY (UNADJUSTED) a | ECONOMIC ACTIVITY (ADJUSTED) b | IMPACT FROM TOURISTS (UNADJUSTED) c | IMPACT FROM TOURISTS (ADJUSTED) d |
|---|---|---|---|---|
| Blue Ridge Highlands | $252,553,078 | $232,348,832 | $127,160,912 | $93,590,431 |
| Central Virginia | $613,143,237 | $613,143,237 | $326,884,719 | $261,507,775 |
| Chesapeake Bay | $76,960,063 | $73,881,660 | $38,348,251 | $29,451,456 |
| Coastal – Eastern Shore | $64,881,866 | $59,691,317 | $34,842,990 | $25,644,441 |
| Coastal – Hampton Roads | $281,330,801 | $281,330,801 | $152,044,672 | $121,635,737 |
| Heart of Appalachia | $38,377,301 | $35,307,116 | $20,697,933 | $15,233,678 |
| Northern Virginia | $754,339,425 | $784,513,002 | $401,564,628 | $334,101,770 |
| Shenandoah Valley | $505,318,244 | $505,318,244 | $272,479,489 | $217,983,591 |
| Southern Virginia | $185,575,897 | $170,729,825 | $99,823,491 | $73,470,089 |
| Virginia Mountains | $251,732,914 | $241,663,597 | $135,311,150 | $103,918,963 |
| GRAND TOTALS: | $3,024,212,824 | $2,997,927,631 | $1,609,158,234 | $1,276,537,931 |
a. Effect of all activity attributed to the region.
b. Effects calibrated to the locality’s economic activity compared to state average.
c. Does not include local resident effects.
d. Impacts calibrated to local economy and reduced by percent not visiting as primary activity.
Virginia Cooperative Extension materials are available for public use, reprint, or citation without further permission, provided the use includes credit to the author and to Virginia Cooperative Extension, Virginia Tech, and Virginia State University.
Virginia Cooperative Extension is a partnership of Virginia Tech, Virginia State University, the U.S. Department of Agriculture (USDA), and local governments, and is an equal opportunity employer. For the full non-discrimination statement, please visit ext.vt.edu/accessibility.
Publication Date
September 6, 2023