Your Financial Health – Interpreting Statements & Using Ratios
ID
AAEC-184NP
Where do you stand financially? Have your finances improved since last year? How much money did you spend last year, and on what? Are you using too much credit? If you have trouble answering these questions, you need to organize your records and measure your financial health. Tracking your financial health is as important to your well-being as taking care of your physical health. As part of the Your Financial Health series, this publication will help you interpret your Balance Sheets and Cash Flow Statements and utilize several financial management ratios that will help you understand and assess the state of your financial health. For a review of balance sheets and cash flow statements, see VCE publications Your Financial Health – Balance Sheets and Your Financial Health – Cash Flow Statements.
Net Worth in the Real World
Even if you have a handle on the basic concepts and components of a balance sheet, you may not know what your net worth means to you. What causes net worth to increase or decrease over time? What does the typical person’s net worth look like throughout their lifetime?
Your net worth can be increased in three ways. First, you can add new money to an asset either by purchasing an asset with your current income or receiving it as a gift. Second, you can use cash inflow to pay down debt. However, if your money only goes towards the interest on a debt and not the principal, it does not decrease your liabilities or increase your net worth. Third, your net worth will increase if the value of one of your assets (stocks, antiques, your home) increases. Examples of these kinds of actions would include:
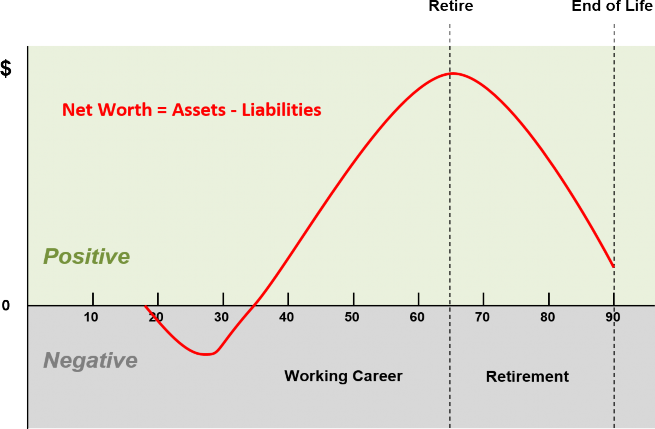
Although no two people are the same, many experience similar patterns of change in net worth over time. Figure 1 depicts a “typical” person’s net worth throughout their life. In the early years of their life, many people have a negative net worth, often due to large liabilities such as student loans or a new mortgage. As people work and earn income, they generally accrue assets, thereby increasing their net worth. At retirement, income stops or is reduced, but expenses continue. As people begin withdrawing from their retirement savings, they decrease their assets and their net worth.
- Directing $100 from your paycheck into your retirement account
- Inheriting $1,500 from your grandmother
- The value of your home increases $1,000
- The value of your retirement account rises 8%
Conversely, your net worth can decrease due to actions opposite those above. In other words, your net worth decreases when you take money out of an asset or increase the principal of a liability, or when one of your assets decreases in value. Examples would include:
- You spend $2,000 from your savings on a vacation rental
- You purchase a new automobile off the showroom floor and the car depreciates in value
- You close on a new home and have to pay closing costs and realtor fees
- You give a $100 gift to a family member
- You pay for your child’s college education
- The value of your home decreases $1,000
There are also actions you may take that will not affect your net value at all. These often represent a shifting of value between assets and liabilities. Examples of “no change” actions include:
- You take $100 from your checking account to pay towards your car loan
• Here your asset decreases by $100 and your liability decreases by $100 - You take $5,500 out of your savings account to open an investment account
• Here your savings account asset decreases but your investment account asset increases
In order to see how your net worth is changing over time, be sure to calculate your personal balance sheet on a regular basis. By regularly taking a snapshot of your finances, you can compare your net worth over time and see changes in your financial health.
Analyzing Your Financial Performance
Once you have balance sheets and cash flow statements for more than one point and period, you can begin using them to assess your financial well-being. Begin comparing your cash flow statements to see if your net income/loss is keeping up with inflation. When prices are rising, your income must rise to maintain your purchasing power. If your income increased 3% last year and the inflation rate was 3%, you broke even. You are not better or worse off than you were in the previous year.
When your liabilities exceed your assets, you have negative net worth, which may be a sign you need to reduce your debt exposure. However, as shown in Figure 1, negative net worth is common in certain situations. In a household survey from 1992-2007, (Mountain and Hanna 2012) found that 7.32% of households had negative net worth. Rather than focus only on the positivity or negativity of your net worth, you can use your balance sheet to determine if it is improving over time. If your accumulation of assets or income is consistently outpacing your debts or expenses, you should be steadily increasing your net worth. The next section of this publication includes the debt-to-income ratio, which will help you determine if you have an excessive amount of debt.
Common Financial Ratios – Calculation and Interpretation
Some of the concepts mentioned above are often measured using common ratios. Here we will cover four financial ratios that can help you assess your financial health. Understanding and recognizing these ratios can also make understanding financial advice easier. Appendix A provides the formulas for the following ratios, as well as space to calculate them.
The liquidity ratio, sometimes referred to as the current ratio, measures your overall liquidity. First, determine the amount of money you have which could be withdrawn quickly and without major penalty. These are your liquid assets, which are usually listed under “Cash and Cash Equivalents”. Examples include money in savings, checking, or money market accounts, as opposed to money in a retirement account. Next, look at your cash flow statement to determine the total value of one month of expenses. Divide the value of your liquid assets by your monthly expenses to determine your liquidity ratio. This number should ideally fall between 3 and 6, representing enough liquid savings to cover 3 to 6 months of expenses, in case of an emergency. This is not the same as your reserve fund, which is intended to cover expected periodic expenses.
You can determine whether you have an excessive level of debt using the debt-to-income ratio. Calculate your monthly debt payments from the expense portion of your cash flow statement (excluding mortgage payments) and divide this number by net (take-home) pay, or the money you have in your pay check after taxes and other deductions. This number will ideally be less than 10% (0.1). A debt-to- income ratio between 10% and 20% is cause for concern. You should not take on any more debt obligations and begin working to reduce your household debt. Above 20% (0.2) is considered the danger zone. By this point, households begin to have difficulty meeting monthly obligations. See extension publication 354-027, Getting Out of Debt, for help reducing your debt burden.
There are two common ratios used for determining appropriate debt payments that include housing payments. Your front end housing ratio is a comparison of your annual housing expenses and your gross annual income. Your housing expenses include PITI (an acronym for principal, interest, tax, and insurance). You should be able to find these expenses on your cash flow statement. This value should be no more than 28% (0.28).
The ratio of annual debt payments to gross annual income is referred to as the back end ratio. To calculate this value, divide the sum of all your debt payments including your housing payment for the year by your gross annual income. This value will ideally be 36% (0.36) or less.
Summary
In order to plan for the future, you have to know where you are right now. Using common financial statements and ratios, you can assess your current financial health. Balance sheets and cash flow statements, coupled with the ratios you can calculate from them, allow you to perform the assessment necessary to identify opportunities for improvement. From there, you can create the plans you need to reach your goals.
References
Mountain and Jones, Forthcoming. Getting Out of Debt. Virginia Cooperative Extension.
Mountain, T.P. and Hanna, S.D. 2012. “Negative Net Worth and the Life Cycle Hypothesis.” Academy of Financial Services 2012 Proceedings.
Appendix A – Financial Management Ratios
| Liquidity (Current) Ratio | ||||
|---|---|---|---|---|
| Liquid Assets | / | Monthly Expenses | X 100 = | Liquidity Ratio |
| $ | / | $ | X 100 = | % |
| Debt-to-Income Ratio | ||||
|---|---|---|---|---|
| Debt Payments | / | Net Pay | X 100 = | Debt-to-Income Ratio |
| $ | / | $ | X 100 = | % |
| Front End (Housing) Ratio | ||||
|---|---|---|---|---|
| Annual Housing Expense | / | Gross Annual Income | X 100 = | Front End Ratio |
| $ | / | $ | X 100 = | % |
| Back End Ratio | ||||
|---|---|---|---|---|
| Annual Housing Expense + Annual Debt Payments |
/ | Annual Gross Income |
X 100 = | Back End Ratio |
| $ | / | $ | X 100 = | % |
Virginia Cooperative Extension materials are available for public use, reprint, or citation without further permission, provided the use includes credit to the author and to Virginia Cooperative Extension, Virginia Tech, and Virginia State University.
Virginia Cooperative Extension is a partnership of Virginia Tech, Virginia State University, the U.S. Department of Agriculture (USDA), and local governments, and is an equal opportunity employer. For the full non-discrimination statement, please visit ext.vt.edu/accessibility.
Publication Date
June 21, 2024