Nitrogen and Phosphorous Fertilization of Corn
ID
424-027
 EXPERT REVIEWED
Corn must have adequate amounts of nitrogen (N) and phosphorus (P) for profitable production. Nitrogen and phosphorus are also the nutrients that produce excessive algae growth in surface waters when concentrations increase above certain critical levels. Profitable and environmentally sensitive corn production requires that N and P be managed in an efficient manner. Economic returns from the use of these nutrients can be maximized, while the potential for surface and groundwater enrichment with N and P can be minimized with the use of appropriate technology. Available technology includes soil testing to evaluate residual soil nutrient supplies, and the use of proper application rates, methods, and timings. The purpose of this publication is to summarize general corn fertilization principles and the most recent research-based recommendations on the use of N and P in Virginia corn production. Although the focus of this article is on N and P, a balanced fertility program including adequate amounts of potassium (K), sulfur (S), and micronutrients is necessary for efficient corn production.
General Principles
Corn Growth & Nutrient Requirements
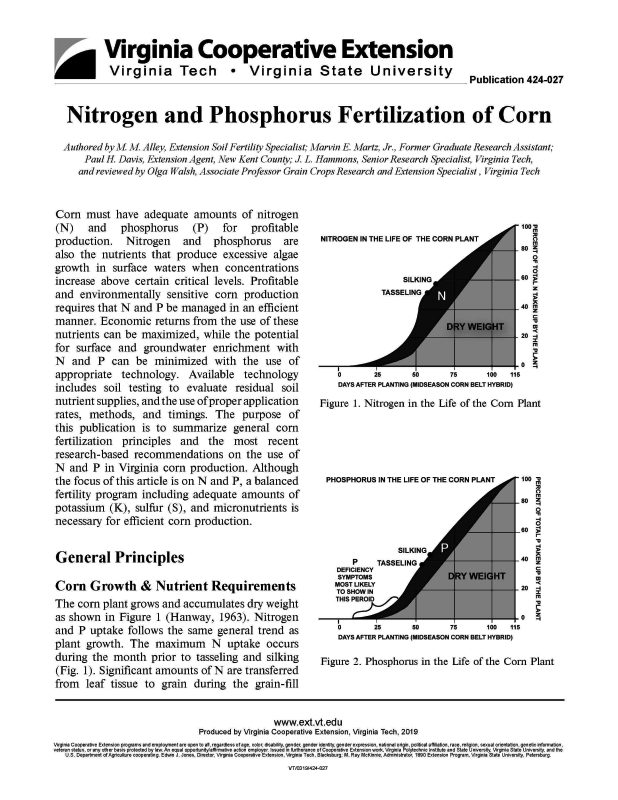
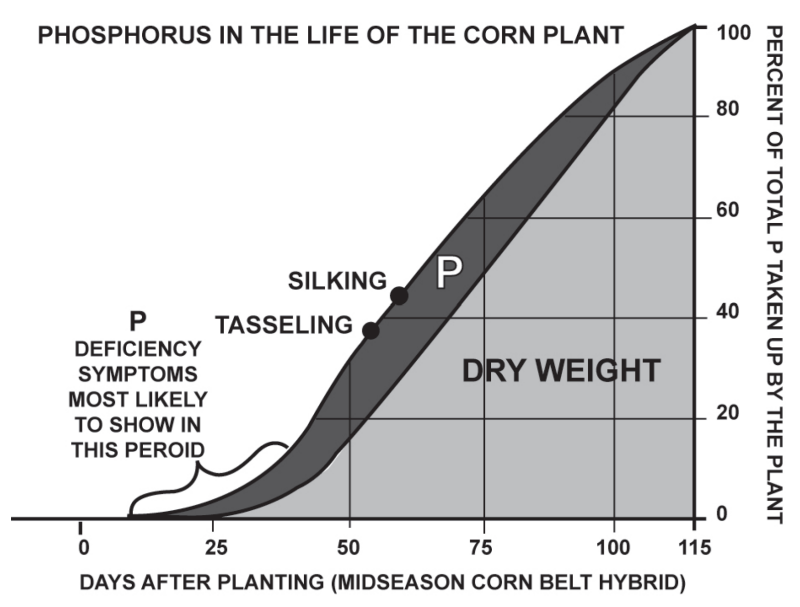
The corn plant grows and accumulates dry weight as shown in Figure 1 (Hanway, 1963). Nitrogen and P uptake follows the same general trend as plant growth. The maximum N uptake occurs during the month prior to tasseling and silking (Fig. 1). Significant amounts of N are transferred from leaf tissue to grain during the grain-fill process. Phosphorus uptake is more constant throughout the season and generally parallels dry weight increases (Fig. 2). The major objective of an efficient fertilization program is to be certain that adequate N and P are available during the growing season so that plant growth and yields are not limited by nutrient supplies.
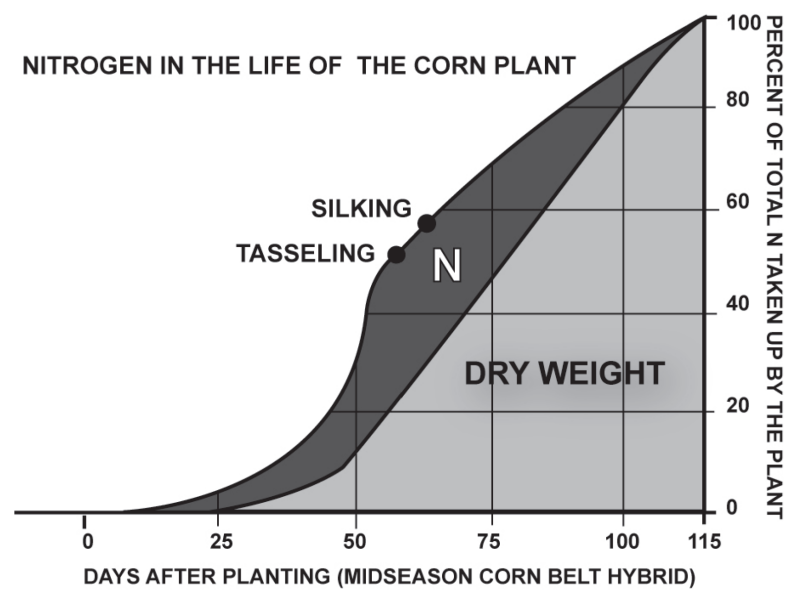
The corn plant requires N and P soon after germination to initiate the growth of stems, leaves and ear structures. Inadequate N availability during the first two to six weeks after planting can result in reduced yield potentials (Jones, 1985). However, the majority of N is needed during the period of maximum growth (month prior to tasseling and silking, Fig. 1). Sidedress N fertilizer applications insure that N is available during this period of highest need. Also, the potential for leaching losses is greatly reduced with sidedress N applications because of high water uptake and transpiration by the corn plant during this period of rapid growth. The warm temperatures associated with rapid corn growth increase soil water evaporation and transpiration rates which reduce nitrate leaching potentials.
Phosphorus availability is equally critical during the early stages of plant growth because the movement of P to plant roots is reduced with cold soil temperatures. Thus, P deficiencies are most often observed during the early part of the growing season. However, P moves very little in soils, and thus, available soil P levels can be built with P fertilizer applications, or applications of manures. Many Virginia agricultural soils have a history of P fertilization, and a recent survey estimates that 58% of Virginia soils test high to excessive in available P (Sharpley et. al., 1994). High plant-available P, as identified by soil testing, indicates that no crop yield response can be expected from additional P fertilizer applications. Excessive soil-available P may cause environmental problems when soil containing these excessive levels of available phosphorus erodes into surface waters.
Fertilizer Placement
Early-season nutrient availability is influenced by fertilizer placement. Germination and emergence of the corn seedling usually occurs in six to ten days with reasonable temperatures and moisture.
The corn seedling can be expected to develop two fully-expanded leaves and a primary root system that obtains needed nutrients from the soil within seven days after emergence (Aldrich et al., 1986). The supply of nutrients in the seed will be exhausted by this time (seven days after emergence). The corn plant roots generally do not reach the middle of the rows until the corn plant has eight fully emerged leaves, which is about the time the corn is knee-high. Therefore, during approximately the first six weeks after planting, nutrients that are band-placed close to the corn row are more likely to be available for corn-plant uptake than if the same amount of nutrients were broadcast over the entire soil surface.
An example of enhanced N availability from starter-band placement is shown in Fig. 3. The percent N in whole corn plant tissue samples collected six weeks after planting (knee-high) was approximately the same with either a starter-band application of 30 lbs N/acre, or a surface broadcast application of 60 lbs N/acre plus 10 lbs N/acre in a starter-band. The starter-band applied N was more efficient in supplying N to the young corn plants.

In addition to enhanced availability with starter-band placement of fertilizer, N placed on the soil surface is subject to several reactions that can result in loss or limit its availability to the corn plant. First, urea forms of N are subject to volatilization losses if the conversion of urea to ammonium occurs while the fertilizer is on the soil surface. Losses can be as high as 30% of the applied urea N if temperatures are warm and rainfall to move the urea into the soil does not occur within three to four days after application (Scharf and Alley, 1988). In addition, N applied to fields with high levels of residue (i.e. no-till) is subject to utilization by the microbes that are decomposing the residue. Finally, surface-applied N fertilizers are subject to runoff losses when heavy rainfall occurs soon after application. Band placement of N fertilizers below the soil surface eliminates the potential for volatilization and runoff losses and removes the N from the zone of highest microbial decomposition in no-till production.
However, a major concern with band placement of fertilizer near the germinating seedling is salt injury. Standard starter-band placement is 2 inches to the side and 2 inches below the seed (2 x 2 placement). The band must be properly placed to avoid salt injury, especially at high rates of starter band fertilizer. Nitrogen and K are the two nutrients that can cause “salt injury.” A general rule for application rate is that the starter-band should contain no more than a total 80 lbs per acre of N plus K2O. Growers must be certain that the fertilizer placement attachment on the planter is properly positioned, and all openers are placing the fertilizer band at least 2 inches from the seed and approximately 2 inches below the seed. Any error in placement must be farther from the seed rather than closer than 2 x 2 in order to prevent damage to the emerging seedlings.
Nitrogen Fertilization Recommendations
Total N Rates
Total N fertilizer applications are governed by the yield potential of individual soil series. Soils that enable deeper rooting depths and have high water-holding capacities will produce greater corn yields than soils with physical properties that restrict root growth, or soils that have sandy textures with low water-holding capacities. Crops grown on soils with higher yield potentials can efficiently utilize higher N fertilizer applications than crops grown on soils with lower yield potentials. Fertilizer N rates should vary with the soil series yield potential, which is mainly a function of plant-available water supplying capacity. General guidelines for corn production potentials for individual soil series can be found in the Virginia Land Use Evaluation System (Simpson et al., 1993). However, grower yield records, whenever available, should be used to establish yield potentials for individual soils and fields.
Research has shown that when efficiently applied, total N rates of 1.0 to 1.25 lb N per bushel of yield potential are adequate to optimize yields. However, obtaining a high N-use efficiency of 1.0 lb N per bushel of corn yield generally requires splitting the N between a starter-band application and a side-dress application.
| Soil Series | Optimum Starter-band N Rate (lbs N/acre) |
Optimum Side-dress N Rate (bu/acre) |
Yield |
|---|---|---|---|
| Pamunkey sil | 66 | 0 | 89 |
| Slagle sil | 70 | 93 | 168 |
| Pamunkey fsl | 70 | 80 | 154 |
| Slagle sl | 49 | 125 | 128 |
| Turbeville s | 127 | 107 | 111 |
| Cullen l | 44 | 58 | 126 |
| Eubanks sil | 70 | 0 | 122 |
| Ross l | 70 | 93 | 105 |
| Pamunkey | 70 | 93 | 148 |
| Soil Series | Mehlich I Available P | P Calibration** | Yield Response | Average Test Yield bu/acre |
|---|---|---|---|---|
| Pamunkey sil | 7 | M+ | No | 87 |
| Slagle sil | 41 | H | No | 149 |
| Pamunkey fsl | 22 | H- | No | 142 |
| Slagle sl | 16 | M+ | No | 147 |
| Turbeville sl | 49 | H+ | No | 95 |
| Cullen l | 8 | M- | No | 116 |
| Eubanks sil | 60 | VH | No | 110 |
| Ross l | 17 | M+ | Yes | *** |
| Pamunkey sil | 12 | M | No | 143 |
*Phosphorus applied at 0, 20, 40, 60 lbs P2O5/acre.
**Mehlich I extractable P calibration (Donohue & Heckendorn, 1994).
***12 bu/acre increase to 60 lbs P2O5/acre.
Starter-band N Rates
Recent research in Virginia that studied starter-band N rates ranging from 10 to 70 lbs N/acre placed in a 2 x 2 band produced the data shown in Table 1. Optimum starter-band rates were determined by analyzing corn yield increases versus the cost of the N required to obtain the yield increase. The average optimum N rate ranged from 27 to 70 lbs of N per acre with the optimum N rate for the nine experiments over two years averaging 60 lbs N/acre. The N rates utilized in these studies were higher than rates evaluated in past experiments because the previous starter-band research had focused on optimizing P rates. Earlier studies used fertilizer materials such as 10-34-0 (ammonium polyphosphate solution) or 18-46-0 (diammonium phosphate). Our research used blends of urea-ammonium nitrate (30% N) solution as the N source, and 10-34-0 as the P source. Dry granular blends of urea and 18-46-0 (DAP) or 10-51-0 monammonium phosphate (MAP) would be expected to produce the same crop responses as the liquids used in these studies. Research in Indiana and Kentucky supports the concept that N is the most important ingredient in starter fertilizers for no-till corn production on soils testing high in plant-available P (Mengel, 1990; L. W. Murdock, Univ. of KY, 1997, personal communication).
Detailed analysis of the starter-band placement data (data not shown) demonstrated that essentially all the yield advantage for the higher starter-band N treatments could be obtained with a 50 lb N/acre starter-band application. The 50 lb N/acre starter-band application reduces the potential for salt injury compared with a 60 lb N/acre application, and it produces almost all of the yield increase associated with the average 60 lb N/acre optimum found in these experiments
Therefore, the general recommendation for starter-band N application is to apply 50 lbs N/acre placed in a 2 x 2 band at planting. This placement minimizes N losses due to volatilization, microbial fixation, and runoff, and provides ample supplies of N in close proximity to the young corn root system. Also, a 50 lbs N/ acre starter-band application provides adequate N to the corn plant for a longer period of time should field conditions delay side-dressing. It is extremely important that the starter-band fertilizer be placed at least 2 inches from the seed to avoid potential salt injury.
Side-dress N Rates
Optimum side-dress N rates varied from 0 to 125 lbs N/acre in the experiments reported in Table 1. This wide range of optimum side-dress N rates is typical of Virginia conditions and is the result of two factors. First, large amounts of N can be released from sources such as manures or previous legume crop residues. Nitrogen release from organic materials (mineralization) increases with increased microbial activity at higher soil temperatures. When fields have a history of manure utilization, or the corn crop is following a legume such as alfalfa, the preside-dress soil nitrate test (PSNT) (Evanylo and Alley, 1996) should be used to assess the release of mineral N from the organic residues. The PSNT procedure has been shown to be effective in Virginia and surrounding states for identifying fields that do not need additional N fertilization at side-dress. Thus, a starter-band N application of 50 lbs N/ acre can be used to get the corn crop started, and the PSNT can be used to determine if side-dress N is needed. Soil samples for the PSNT must not be taken from the soil where the starter-band has been placed.
The second and most important factor that causes widely varying optimum side-dress N rates for corn grown in Virginia is drought stress during silking and tasseling. Drought stress cannot be predicted in any specific season, but long-term, realistic yields for the specific soil series are currently the best way to determine side-dress N rates. Although the realistic yield may not always be achieved, the combination of starter-band and side-dress N is the most effective means of insuring that N does not limit crop yields, and that the applied N is utilized efficiently.
Phosphorus Fertilizer Recommendations
Phosphorus fertilizer recommendations are based on plant-available soil test P levels that have been established for many years. The use of soil tests such as the Mehlich I and Bray P1 tests is based on P being relatively immobile in soil, and on crop response to applied P fertilizer being related to the soil test P level. Tests such as the Mehlich I and the Bray P1 have been used successfully for many years. However, there is a legitimate concern that as corn yield levels increase, the soil test levels necessary to insure adequate P availability may need to be increased. We recently conducted several experiments to determine responses to P fertilization at Mehlich I soil test levels typical of Virginia soils.
Data from nine experiments are shown in Table 2. These experiments involved the application of starter-band P at rates of 0, 20, 40, and 60 lbs P2O5/acre with optimization of all other production factors to achieve highest possible yields. Mehlich I soil test levels ranged from 8 to 60 ppm available P. There was only one grain yield response to applied P in these experiments in which grain yield levels were reasonably high for the specific growing seasons. The conclusion from these data is that the current soil test calibration levels for plant-available P are adequate and do not need to be revised.
In summary, soil test P levels are adequate indicators of corn grain yield response to applied P. The calibration of soil tests is such that no grain yield responses will be expected when soil test P levels are in the high (H) to very high (VH) range. All fields should be tested for plant- available P and applications made according to soil test levels.
Acknowledgments
The authors wish to acknowledge financial support of the Virginia Corn Board and the Division of Soil and Water Conservation to complete the field and laboratory research for this publication. Appreciation is also expressed to the farmers who allowed us to utilize their farms for the field research.
References
Aldrich, Samuel R., Walter O. Scott, and Robert G. Hoeft. 1986. Modern Corn Production. 3rd edition. A & L Publications, Inc., Champaign, IL.
Evanylo, G. K. and M. M. Alley. 1996. Nitrogen soil testing for corn in Virginia. Virginia Cooperative ExtensionPublication418-016.VirginiaTech,Blacksburg, VA.
Hanway, J. J. 1963. Growth stages of corn (Zea mays, L.). Agron. J. 55:487-492.
Jones, C. A. 1985. C4 grasses and cereals: growth, development, and stress response. John Wiley & Sons, Inc., New York.
Mengel, D. B. 1990. Fertilizing corn grown using conservation tillage. Agronomy Guide, AY-268. Purdue Univ. Coop. Ext. Service. West Lafayette, IN.
Scharf, Peter C. and M. M. Alley. 1988. Nitrogen loss pathways and nitrogen loss inhibitors: A review. J. of Fertilizer Issues 5:109-125.
Sharpley,A.N.,S.C.Chapra,R.Wedepohl,J.T.Sims,T. C. Daniel, and K. R. Reddy. 1994. Managing agricultural phosphorus for protection of surface waters: issues and options. J. Environ. Qual. 23:437-451.
Simpson,T.W.,S.J.Donohue,G.W.Hawkins,Margaret M. Monnett, and J. C. Baker. 1993. The development and implementation of the Virginia Agronomic Land Use Evaluation System. Dept. of Crop and Soil EnvironmentalSciences,VirginiaTech,Blacksburg, VA, 83 pgs.
Virginia Cooperative Extension materials are available for public use, reprint, or citation without further permission, provided the use includes credit to the author and to Virginia Cooperative Extension, Virginia Tech, and Virginia State University.
Virginia Cooperative Extension is a partnership of Virginia Tech, Virginia State University, the U.S. Department of Agriculture (USDA), and local governments, and is an equal opportunity employer. For the full non-discrimination statement, please visit ext.vt.edu/accessibility.
Publication Date
August 7, 2024