

Consider Your Whole System: Nitrogen and Sulfur Leaching Potential in Virginia
ID
SPES-39NP
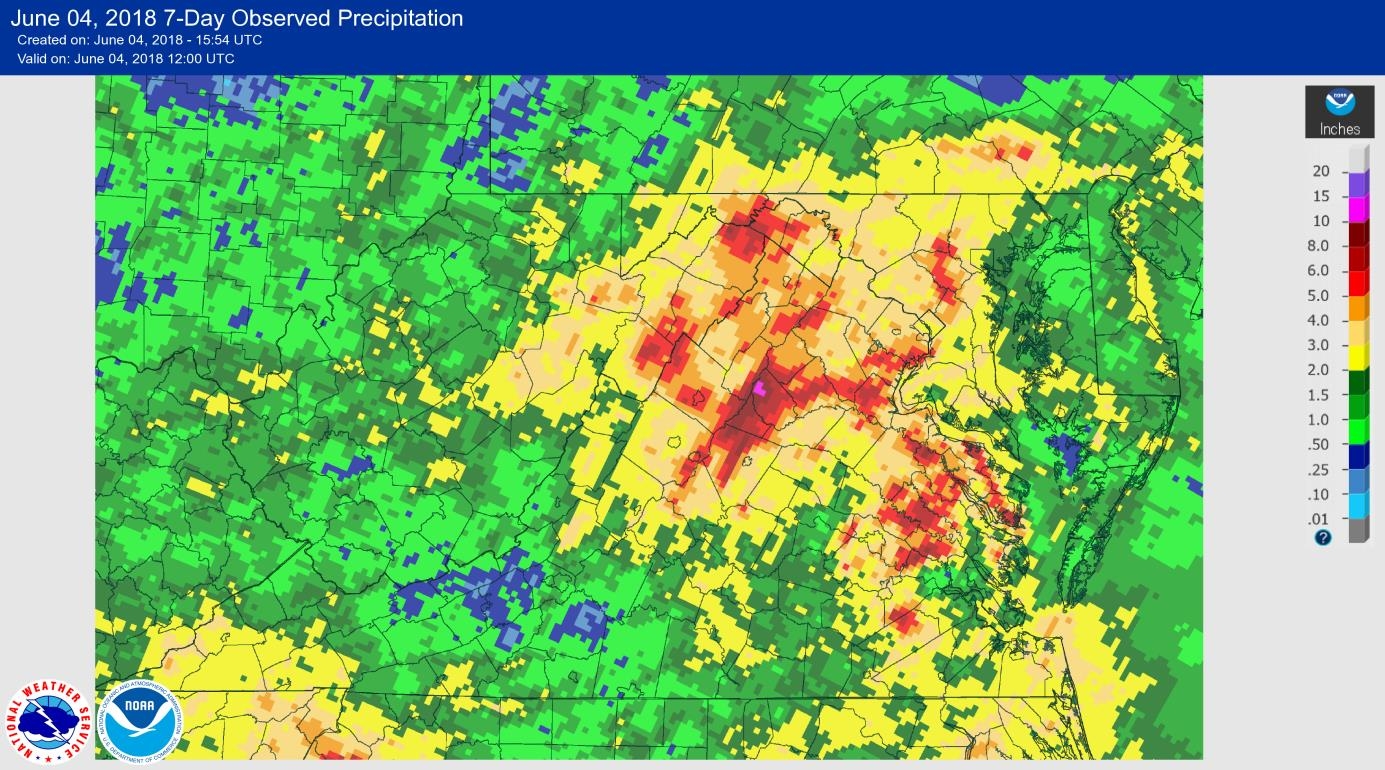
Early summer often means locally heavy and sporadic rainfall as thunderstorms deliver intense rains, and 2018 appears to be no different with many areas in eastern Virginia receiving 3+ inches of rain in a few days (Figure 1). These storms also often coincide with the timing of sidedress nitrogen (N) and sulfur (S) applications on corn. While some rainfall after sidedress is very beneficial to facilitate N movement into soil, heavy rain (2+ inches) often leaves us wondering how much, if any, of that recently-applied N remains and if additional N is needed.
First, the N fertilizer we apply is water soluble so the portion that remains on leaves, residue and the soil surface is subject to runoff with heavy rains. Second, saturated or ponded soils typically undergo anaerobic conditions resulting in denitrification. The losses under saturated conditions occur quickly, within a few hours, but at this time of year those losses are typically small and in the range of 5 to 10 lbs. N/ac. However, denitrification rates will increase as soil warms and/or soil remains saturated (>5 days). In Virginia, we typically do not see an entire field undergo significant denitrification, but you may see this problem in “wet spots” that have extended durations of soil saturation. Third, the nitrate portion of fertilizer sources is subject to leaching in soils with sand textures; which is the predominant soil texture in eastern Virginia.
The majority of sidedress N on corn is applied as urea-ammonium nitrate liquid (UAN); which derives approximately 50% of fertilizer N from urea and 50% from ammonium nitrate (IPNI, 2015). Liquid UAN is a water-soluble fertilizer salt with the nitrate portion (~25% of total N) available immediately for plant uptake and leaching susceptibility. However, it takes a few days to a week for the remainder of the fertilizer to undergo biochemical reactions once applied to become plant available – think about the time it takes for a crop to ‘green-up’ after N application as a reference. Once these reactions occur, the fertilizer will be broken into ammonium, which is not generally subject to leaching losses, and nitrate which does readily leach. Over time, soil microbes will convert all fertilizer N to the nitrate form; with this conversion speed depending on your specific soil temperature, moisture, and pH.
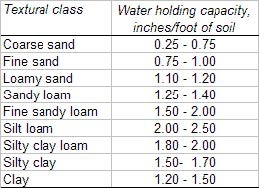
The degree of nitrate leaching depends on the amount of water moving through the soil, how much of that water is moving below the root zone, and the total amount of nitrate present. Recent work in Maryland highlights the “risk” of nitrate leaching based on the “exchange frequency index” (EFI) (Forrestal et al., 2014). The EFI value is based on the available water holding capacity of a soil (an estimate by soil texture) and the amount of rainfall that has occurred. They define an EFI of less than 1.5 as low to moderate risk of leaching and greater than 1.5 EFI as a high risk of leaching. So for example, let’s say you have corn planted on a sandy loam textured soil in eastern Virginia; which has a typical water holding capacity of 1.25 to 1.40 inches per foot of soil (Figure 2). At knee-high, corn roots have a maximum depth of about 10-inches. Based on the figure 2 table values, a 2.0 inch rain event on a sandy loam soil would give you an EFI of 1.6. The EFI is calculated by dividing the 2.0 inch rainfall event by the 1.25 inches of water per foot from sandy loam soils. This particular field therefore had a high potential of leaching since the EFI was greater than 1.5. Alternatively, a 1.5 inch rain event would result in a low to moderate risk of leaching since the calculated EFI is 1.2. However, remember that the amount of your total fertilizer N applied might not yet be all nitrate since UAN is a mixed fertilizer source. You can estimate your soil texture for Figure 2 by mapping your field using the USDA-Natural Resources Conservation Services’ Web Soil Survey found at: https://websoilsurvey.sc.egov.usda.gov/App/HomePage.htm.
So, in this example of a 2-inch rainfall event, it is likely that significant nitrate leaching could have occurred for sandy loam soils and that additional N application should be considered. How much (if any) additional N is needed will be based on site-specific conditions for each field. Losses will likely be highest in instances where sidedress occurred within a few days of heavy rainfall, on the coarsest textured soils, and with higher total N rates. Losses up to 25% of the total sidedress rate have been documented, though losses are often less. For producers that placed all of their N out at-planting or before, losses may be substantially higher as the plant did not have time to take up the N and most of the soil fertilizer was likely converted to the nitrate (leachable) form by microbes prior to the rainfall. Splitting N between a minimum of two applications at different corn grown stages (at-planting and knee-high) is always best.
Similar to N, S is a mobile nutrient in the soil system. Sulfur sources to plants are from fertilizer, air emissions, and by being released from soil organic matter. In cool and wet springs, sulfur may be deficient to young corn plants as soil organic matter cycling is low and sulfates (the plant available form of sulfur) may have leached below the plants’ effective root zone. Sulfur may especially appear deficient on soils that are coarse textured and low in organic matter; which is common in the coastal plain.
There are several in-season techniques for monitoring crop N and S status, including the pre-sidedress soil nitrate test (PSNT), plant tissue testing, etc., that can be implemented to make the best informed decisions in cases where unknown fertilizer losses have occurred. Many private labs can email or fax results back within a day or two after sample submission. For around $10 for soil and $25 for plant tissue, tests will give exact nutrient concentrations and pinpoint what nutrients may be in short supply. Soil nitrate tests should be taken from several portions of the field to a depth of 12-inches. Plant tissue tests for corn less than 12-inches tall should be taken from theaboveground plant from 30 different plants across the entire field. Between 12 inches tall and tassel, sample the upper-most fully developed leaf (leaf has a “collar”). Overall, the time and money it takes to test your corn is small compared to the fertilizer inputs you have already or will potentially invest.
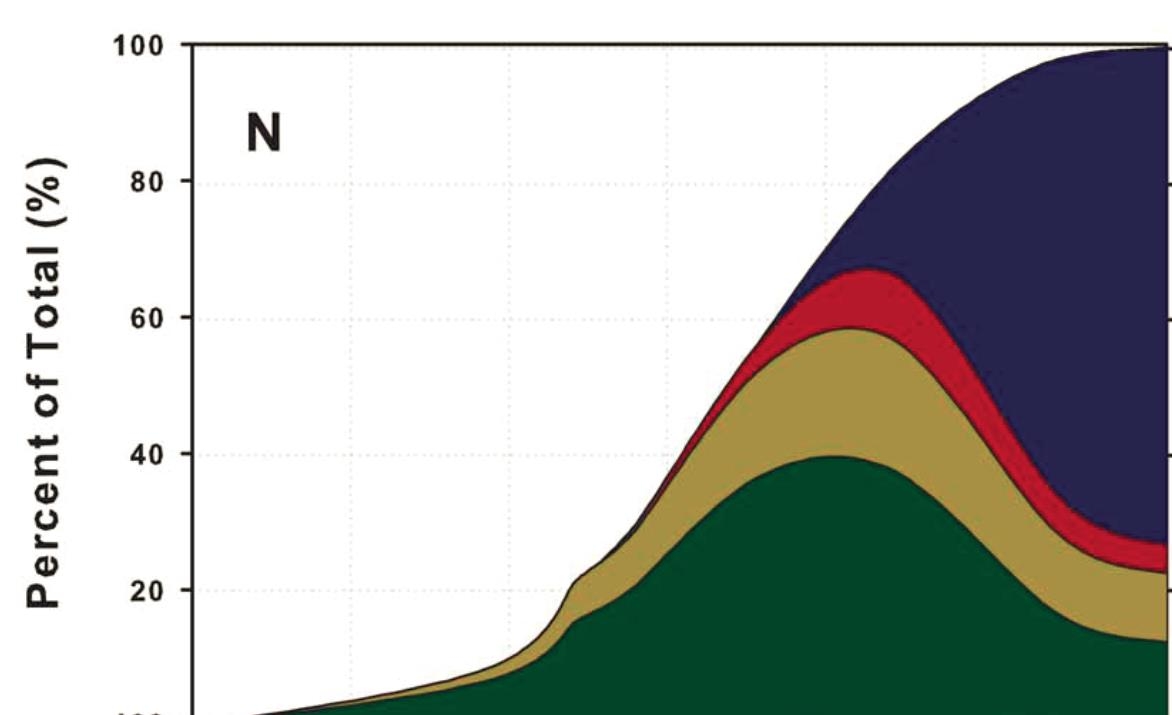
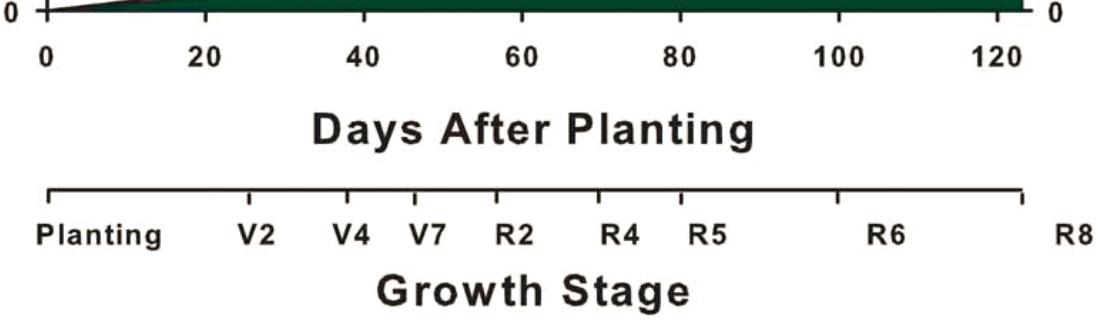
Nitrogen and S corrections can be made if deficient throughout the season with data showing that applications as late as tassel may be beneficial for crop yield. Data indicates that significant N is taken up from the soil throughout the corn growing season (Figure 3). However, farmers should note that “feeding the soil” is the safest and most efficient way to supply N and S nutrition to plants. While foliar feed fertilizers are available, it is difficult to supply sufficient N or S fertility to the corn crop and with foliar feeds you always run the risk of leaf injury. For more information on proper fertilizer use and placement in field corn and PSNT, consult Virginia Cooperative Extension publications #424-027 (Nitrogen and Phosphorus Fertilization of Corn) and #418-016 (Nitrogen Soil Testing for Corn in Virginia).
Overall, N loss predictions depend on many variables and should be calculated on a field by field basis and consider soil texture, rainfall amount and intensity, time since last fertilizer application, fertilizer used, and corn growth stage. Ultimately, unless you applied all your fertilizer at planting or before, you probably did not lose as much as you think. However, considerations should be made if your field is in an excessive rainfall area. Speak with your local Cooperative Extension Agent if you need to review your agronomic fertility plan further. A list of agents can be found here: https://ext.vt.edu/offices.html.
Acknowledgments
Funding for this work was provided in part by the Virginia Agricultural Experiment Station and the Hatch program of the National Institute of Food and Agriculture, US Department of Agriculture.
References
Bender, Ross R., Jason W. Haegele, and Frederick E. Below. 2015. Nutrient Uptake, Partitioning, and Remobilization in Modern Corn Varieties. Agron. J. 107:563–573.
Forrestal, P., J. Meisinger, and R. Kratochvil. 2014. Winter wheat starter nitrogen management: A preplant soil nitrate test and site-specific nitrogen loss potential. Soil Sci. Soc. Am. J. 78 (3):1021-1034.
International Plant Nutrition Institute (IPNI). 215. Urea-ammonium nitrate [Online]. Nutrient Source Specifics No. 7. Available at: http://www.ipni.net/publication/nss.nsf/0/5BB8639163BB14E3852579AF0075540B/$FILE/NSS-07%20Urea%20Ammonium%20Nitrate.pdf (verified 5 June 2018). Norcross, GA.
NOAA-National Weather Service. 2018. Rainfall total map [Online]. Available at: https://water.weather.gov/precip/# (verified 4 June 2018). NOAA-National Weather Service, Washington, D.C.
University of Nebraska Cooperative Extension (UNCE). 2015. Soils – Part 2: Physical properties of soil and water [Online]. Available at: http://passel.unl.edu/pages/informationmodule.php?idinformationmodule=1130447039&topicorder=10&maxto=10&minto=1 (verified 5 June 2015). Lincoln, NE.
Virginia Cooperative Extension materials are available for public use, reprint, or citation without further permission, provided the use includes credit to the author and to Virginia Cooperative Extension, Virginia Tech, and Virginia State University.
Virginia Cooperative Extension is a partnership of Virginia Tech, Virginia State University, the U.S. Department of Agriculture, and local governments. Its programs and employment are open to all, regardless of age, color, disability, sex (including pregnancy), gender, gender identity, gender expression, national origin, political affiliation, race, religion, sexual orientation, genetic information, military status, or any other basis protected by law
Publication Date
January 31, 2024
