How Do Stream Buffers Reduce the Offsite Impact of Pollution?
ID
BSE-38NP (BSE-216NP)
What Is a Buffer?
Buffers take many forms, but one commonality among all buffers is that they are vegetated areas located between a pollution source area and a water body and are intended to reduce stormwater flow and prevent pollution (such as nutrients* and sediments) from entering the water body.
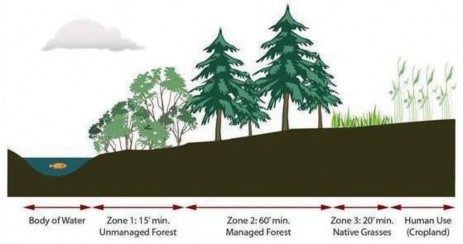
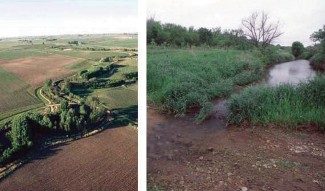
A buffer may be made up primarily of grasses and non-woody plants (vegetated buffer) or may include a combination of non-woody and woody plants (riparian buffer; figs. 1 and 2). The plants in a buffer absorb nutrients, trap sediments, reduce erosion, and slow down water as it moves from the land to a water body.
Buffers are a low-cost and sustainable best management practice (BMP) and are considered to be one of the most reliable practices to remove many pollutants. They are designed to function similarly to natural near- stream areas and should require minimal maintenance to function properly. Buffers can range from as little as 15 feet in width to more than 200 feet (fig. 1).
Where Can Buffers Be Used?
Buffers are appropriate almost anywhere. Consideration should be given to the site characteristics of any proposed area for a buffer. These considerations should include soil type/texture, slope, width, contributing area, flow path, and waste strength characteristics when determining where buffers can be located and which types are most appropriate.
Flow paths are perhaps the most critical site consideration. Water flowing over the soil surface requires mechanisms to slow the velocity of the water and pro- mote infiltration of water and pollutants, usually pro- vided by dense vegetation (e.g., vegetated buffers). If the dominant flow path is subsurface, then mechanisms to remove water from the soil are needed. In this case, riparian buffers (e.g., trees) that have more extensive and deeper root zones can remove more water and nutrients from the soil via evapotranspiration.
Areas with steep slopes often require a larger buffer area to slow the water velocity and allow the buffer to attenuate the flow. Likewise, areas with dense or clayey
soils might need more area in buffers due to lower infiltration rates and greater runoff volumes.
The area contributing runoff or subsurface flow, often called the contributing area, is an important consideration when sizing a buffer. Large contributing areas often contribute more flow than smaller contributing areas and thus require a larger buffer area for adequate treatment.
How Do Buffers Work?
Buffers can influence the water quantity and water quality of surface runoff and groundwater.
“Water quantity control” is provided by buffers in the form of reduced runoff velocity and increased infiltration as the water moves though the buffer. Buffers also effectively reduce and retard peak stream flows by vegetation interacting with the flows.
“Water quality improvement” in buffers is provided by many processes, including biological uptake, microbial decomposition, denitrification, adsorption, and settling. Buffers are most effective at removing excess nutrients and sediment by providing increased contact between pollutants and active microbial or adsorptive surfaces and by plant uptake.
Benefits
In addition to removing many pollutants from runoff and subsurface flows, buffers help keep streams cooler, maintain stable stream banks, and reduce flooding. Buffers allow groundwater to be recharged and sediment to be deposited, which helps rebuild and strengthen stream banks (Williams, Clark, and Balch 2004). Buffers can also provide valuable habitat for wildlife (VA-DCR 2012).
Limitations
The space required is about 2 percent to 5 percent of the watershed that drains through the buffer. If land is expensive, this can mean a high treatment cost.
The time required for establishment can be lengthy, especially for forested riparian buffers.
Buffers can become saturated with some nutrients, such as phosphorus, or inundated with sediment from erosion.
Buffers are not always effective in treating higher flows (that may overwhelm and inundate the vegetation) or in reducing the residence time of the pollutant within the buffer.
Maintenance
Routine Maintenance (annually)
Monitor sediment levels. Excess sediment can fill in the buffer, harming vegetation and reducing performance.
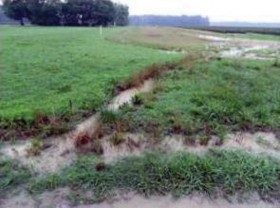
Inspect the buffer regularly to make sure erosion or channelized flow is not occurring and repair as needed (fig. 3).
- Remove trash and debris.
Nonroutine Maintenance (as needed)
Remove excess accumulated sediment.
Control invasive species and thin the woody growth to keep vegetation manageable and to promote uptake of pollutants.
Performance
Buffers are effective at removing multiple pollutants from incoming water. A typical buffer is expected to reduce total phosphorus by as much as 50 percent, total nitrogen by up to 80 percent, and sediment by up to 60 percent. Over time, however, buffer efficiency can be reduced due to excessive pollutant loading, particularly for pollutants such as phosphorus and sediment (Mayer et al. 2006).
Expected Cost
The use of buffers is a relatively inexpensive pollutant treatment practice when compared to other alternatives. A very preliminary estimate of the cost of installing a buffer is $500 to $1,150 per acre. A 1-acre buffer can treat areas ranging from 15 to 45 acres. This cost estimate is based on similar projects in the Mid-Atlantic region. Annual maintenance costs are estimated to be 1 percent to 3 percent of the construction cost. The value of land is not included in this analysis (Countryman and Murrow 2000; Yuan, Dabney, and Binger 2002).
Additional Information
Current Chesapeake Bay Preservation Act regulations require a 100-foot buffer on water bodies consisting of “tidal wetlands, non-tidal wetlands connected by surface flow and contiguous to tidal wetlands, or water bodies with perennial flow, tidal shores, such other lands considered necessary to protect the quality of state waters” (VA-DCR 2009). Many other areas outside of the Chesapeake Bay watershed have adopted these setback regulations. Check with your local conservation organization or the appropriate state or federal organization for rules governing buffers in your area (see online resources).
There are cost-share programs offered by state and federal entities to offset the cost of installing and maintaining buffers. For more information, see the online resources that follow.
Online Resources
U.S. Department of Agriculture, Farm Service Agency (includes the Conservation Reserve Program [CRP] and Conservation Reserve Enhancement Program [CREP]) – www.fsa.usda.gov/
U.S. Department of Agriculture, Natural Resources Conservation Service (includes the Environmental Quality Incentive Program [EQIP], Wildlife Habitat Incentive Program [WHIP], and Wetlands Reserve Pro- gram [WRP]) – www.nrcs.usda.gov/
Virginia Association of Soil and Water Conservation Districts – www.vaswcd.org/
Virginia Department of Conservation and Recreation, Chesapeake Bay Local Assistance, Regulations for Tidewater Localities – www.cblad.state.va.gov
Virginia Department of Conservation and Regula- tion. 2009. “Resource Protection Area: Onsite Buffer Area Delineation; Guidance on the Chesapeake Bay Preservation Area Designation and Management Regulations” – www.dcr.virginia.gov/stormwater_manage- ment/documents/RPA_buffer_delineation_rev090615. pdf&sa=U&ei=wuEGUN6cJqKB6QG7ponYCA&ved=0CAcQFjAB&client=internal-uds-cse&usg=AFQjC NELFkMD7aDZL9lpmoS8d1WKb2vFIw
Virginia Department of Conservation and Recreation, Stormwater Management. “Nonpoint Source Pollution Best Management Practices” – http://dcr.virginia.gov/ stormwater_management/npsbmp.html
Virginia Department of Forestry, Riparian Buffer Tax Credit – www.dof.virginia.gov/
Companion Virginia Cooperative Extension Publications
Virginia Cooperative Extension publication 420-151, “Understanding the Science Behind Riparian Forest Buffers: Effects on Water Quality” – http://pubs.ext. vt.edu/420/420-151/420-151.html.
References
Countryman, D. W., and J. C. Murrow. 2000. “Economic Analysis of Contour Tree Buffer Strips Using Present Net Value.” Journal of Soil and Water Conservation 55 (2): 152–60.
Mayer, P. M., S. K. Reynolds Jr., M. D. McCutchen, and T. J. Canfield. 2006. Riparian Buffer Width, Vegetative Cover, and Nitrogen Removal Effectiveness: A Review of Current Science and Regulations. U. S. Environmental Protection Agency, National Risk Management Research Laboratory. EPA/600/R-05/118, October 2005. Cincinnati: EPA.
VA-DCR (Virginia Department of Conservation and Recreation). 2009. “Resource Protection Area: Onsite Buffer Area Delineation; Guidance on the Chesapeake Bay Preservation Area Designation and Management Regulations” – www.dcr.virginia.gov/stormwater_management/documents/ RPA_buffer_delineation_rev090615.pdf&sa=U&- ei=wuEGUN6cJqKB6QG7ponYCA&ved=0CAc QFjAB&client=internal-uds-cse&usg=AFQjCN ELFkMD7aDZL9lpmoS8d1WKb2vFIw.
VA-DCR. 2012. “Stormwater Management: Nonpoint Source Pollution Best Management Practices.” http://dcr.virginia.gov/stormwater_management/npsbmp.shtml.
Williams, J. R., P. M. Clark, and P. G. Balch. 2004. “Streambank Stabilization: An Economic Analysis From the Landowner’s Perspective.” Journal of Soil and Water Conservation 59 (6): 252–59.
Yuan, Y., S. M. Dabney, and R. L. Bingner. 2002. “Cost Effectiveness of Agricultural BMPs for Sediment Reduction in the Mississippi Delta.” Journal of Soil and Water Conservation 57 (5): 259–68.
Glossary of Terms
Adsorption – The active or passive movement of chemical ions (nitrate or phosphate) onto surfaces that can bind them.
Anaerobic – Chemical reactions that proceed without the presence of oxygen.
Best management practice (BMP) – Any treatment practice for agricultural lands that reduces pollution from stormwater. A BMP can be either a physical structure or a management practice.
Biological uptake – The process by which plants absorb nutrients for nourishment and growth.
Contributing area – The area of a watershed contributing flow to a given area (e.g., a buffer). All else being equal, a buffer with a large contributing area will have to assimilate more flow than a buffer with a smaller contributing area.
Denitrification – The transformation of nitrates to nitrites, nitric oxide, nitrous oxide, and ultimately to dinitrogen gas, which is lost to the atmosphere (e.g., the nitrogen cycle). Denitrification is fostered by anaerobic, carbon-rich conditions.
Erosion – The movement of soils and rock through weathering from water and wind.
Evapotranspiration – The sum of water transferred to the atmosphere, removed from the soil and other surfaces by evapotranspiration and from plants by transpiration.
Flow path – The pathway that water takes as it moves from source area to buffer can be either runoff (surface) or groundwater (subsurface).
Habitat – The environment where organisms, like plants, normally live.
Infiltration – The process by which water (surface water, rainfall, or run- off) enters the soil.
Microbial decomposition – The breakdown of compounds or organic matters into smaller ones by microorganisms.
Nutrients – Substances required for growth of all biological organisms. When considering water qualities, the nutrients of most concern in stormwater are nitrogen and phosphorus because they are often limiting in downstream waters. Excessive amounts of these substances are pollution and can cause algal blooms and dead zones to occur in streams and estuaries.
Residence time – The average time it takes water to travel through a treatment system. Residence time can also be called detention time.
Riparian buffer – Describes the near stream area, usually forested, which shades and protects a stream from the impact of adjacent land uses by slowing runoff, filtering sediment and pollutants, and enhancing infiltration into the soil.
Sediment – Soil, rock, or biological material particles formed by weathering, decomposition, and erosion. In water environments, sediment is transported across a watershed via streams.
Settling – The process by which particles that are heavier than water fall to the bottom under the influence of gravity.
Slope – The change in elevation over a given distance.
Soil texture – Describes the composition of soil based on its proportion of particle sizes. According to the U.S. Department of Agriculture’s classification, soils are classified as sands (larger than 0.05 millimeter), silts (0.002 to 0.05 mm), and clays (smaller than 0.002 mm). Soil texture is the spe- cific combination of particle sizes.
Sustainable – The ability of the system to endure and remain productive over a long time.
Vegetated buffer – An area of vegetation intended to slow runoff, filter sediment and pollutants, and enhance infiltration into the soil.
Watershed – A unit of land that drains to a single “pour point.” Boundaries are determined by water flowing from higher elevations to the pour point. The pour point is the point of exit from the watershed, or where the water would flow out of the watershed if it were turned on end.
Virginia Cooperative Extension materials are available for public use, reprint, or citation without further permission, provided the use includes credit to the author and to Virginia Cooperative Extension, Virginia Tech, and Virginia State University.
Virginia Cooperative Extension is a partnership of Virginia Tech, Virginia State University, the U.S. Department of Agriculture, and local governments. Its programs and employment are open to all, regardless of age, color, disability, sex (including pregnancy), gender, gender identity, gender expression, national origin, political affiliation, race, religion, sexual orientation, genetic information, military status, or any other basis protected by law
Publication Date
October 31, 2022