Predicting Tractor Diesel Fuel Consumption
ID
442-073 (BSE-328P)
Introduction
Ability to predict tractor fuel consumption is very useful for budgeting and management. The objective of this factsheet is to develop relationships using field measurements and Nebraska Tractor Test Laboratory results to estimate tractor fuel consumption. Using these equations, farmers can estimate and compare the fuel consumption for different operating and loading conditions.
Depending on the type of fuel and the amount of time a tractor or machine is used, fuel and lubricant costs will usually represent at least 16 percent to over 45 percent of the total machine costs. Thus, fuel consumption plays a significant role in the selection and management of tractors and equipment used in agriculture. Currently, most budget models use a simplified methods for estimating fuel consumption. Better estimates representing actual field operations are needed to compare machinery management strategies.
The worth of a tractor is assessed based on work output and the cost associated with completing the task. Draw-bar power is defined by pull (or draft) and travel speed. An ideal tractor would convert all fuel energy into use- ful work at the drawbar. However, due to power losses, not all fuel energy is converted into useful work.
Efficient operation of farm tractors may depend on: (1) maximizing the fuel efficiency of the engine and the mechanical efficiency of the drivetrain, (2) maximizing tractive efficiency of the traction devices, and (3) selecting an optimum travel speed for a given tractor-implement system. This factsheet focuses on methods to estimate and improve fuel efficiency of a diesel power unit.
The Nebraska Tractor Test Laboratory (NTTL) has a long history of testing tractors and disseminating power and fuel consumption data. The NTTL is the official testing station for agricultural tractors in the United States. Tractors manufactured in the United States and other countries are tested, and NTTL publishes the test results. During standardized tests, the power is calculated and the corresponding fuel consumption is measured. The power at the power takeoff (PTO) is calculated from the torque and speed at the PTO. Draw-bar power is calculated from the drawbar pull and the forward speed of the tractor. For more details and for a sample test report, see Using Tractor Test Data for Selecting Farm Tractors.
Terminology
Tractor manufacturers specify power output at several tractor locations, such as power takeoff, drawbar, hydraulic outlets, and electrical outlets. For each tractor model, the rated power output is measured at the rated engine speed. Typically, this power is measured at the PTO, and in this factsheet, it is referred to as “rated PTO power.” For most modern tractors, the rated power will not be the maximum available power. Most modern engines often produce more power because they can be operated at speeds other than rated speeds.
Fuel consumption is measured by the amount of fuel used during a specific time period. The most common measure of the energy efficiency of a tractor is referred to here as “specific volumetric fuel consumption” (SVFC), which is given in units of gallons per horsepower-hour (gal/hp-h).
Specific volumetric fuel consumption is generally not affected by engine size, and it is used to compare the energy efficiencies of tractors with different size engines and under different operating conditions. SVFC for diesel engines typically ranges from 0.0476 to 0.1110 gal/hp-h.
For ease of computation, the reciprocal of SVFC is often used and is referred to here as “specific volumetric fuel efficiency” (SVFE) with units of horsepower-hours per gallon (hp-h/gal), with corresponding ranges from 12 to 21 hp-h/gal.
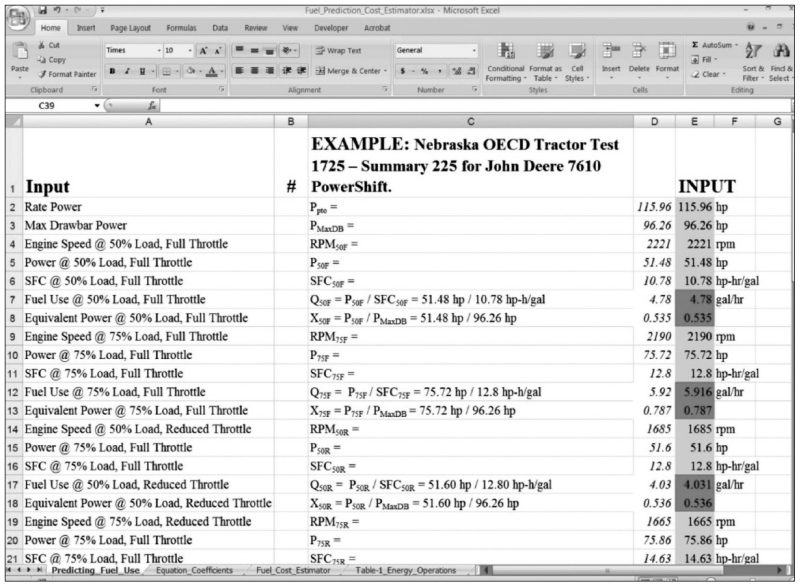
The NTTL reports the SVFE for several drawbar load tests, rated PTO speed, and varying PTO power tests. Table 1 shows sample data from an NTTL report. The SVFE for this test is shown under the columns labeled with units of hp-h/gal (kW-h/L). For example, at rated engine speed, the tractor shown in Table 1 developed 115.96 PTO horsepower with an SVFE of 17 hp-h/gal.
Table 1. Example of a Nebraska Tractor Test Laboratory (NTTL) report.
The sections show: top, the PTO performance tests; center, the varying power tests; and bottom, the drawbar performance test results. This is taken from the report of Nebraska OECD Tractor Test 1725 – Summary 225 for John Deere 7610 PowerShift.
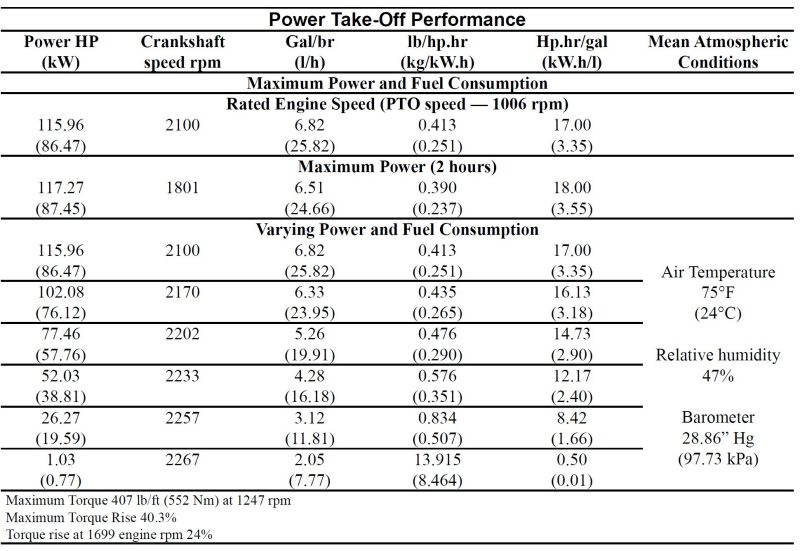
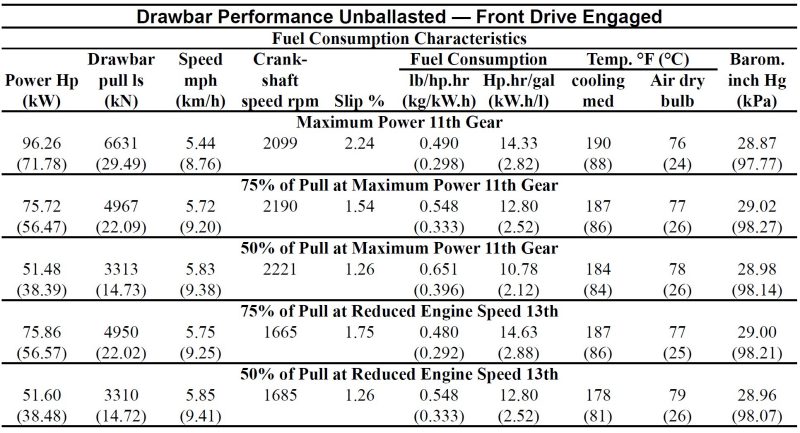
The data from NTTL Report 1725 (shown in Table 1) is used to demonstrate the difference of load level. For the drawbar performance at “75% of Pull at Maximum Power,” the engine speed was 2,190 rpm, and the SVFE was 12.80 hp-h/gal. The corresponding test with a reduced throttle setting had an engine speed of 1,665 rpm and an SVFE of 14.63 hp-h/gal. The SVFC was calculated as 0.0781 gal/ hp-h for full throttle and 0.0684 gal/hp-h for the reduced throttle test. The decrease in SVFC was 12.4 percent, while the engine speed was reduced by 24 percent. Similarly, the “50% of Pull at Maximum Power” tests resulted in a 24 percent reduction in engine speed and a 15.8 percent decrease in SVFC.
Tractor Fuel Efficiency Improvements
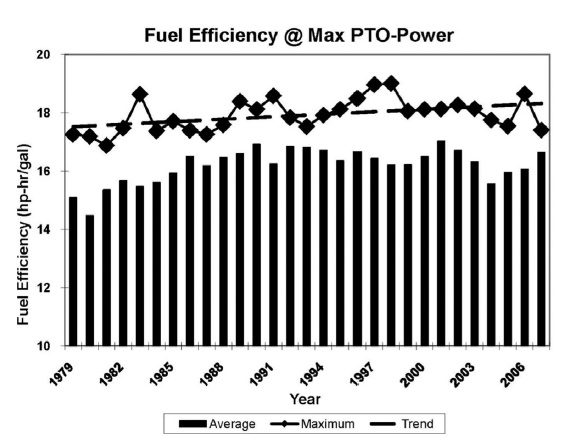
Newer tractors are generally more efficient than previous models. Improvements in fuel efficiency during the last 20 years prove this point. Figure 1 shows the average and maximum specific fuel consumption of tractors tested from 1980 to 2000. Models tested in 2000 averaged 16.5 hp-h/gal, compared to an average of 14.5 hp-h/gal for models tested in 1980. The fuel savings of 10 to 15 percent became possible because of improved engine/transmission design and improved ability to match tractors and implements for given field conditions. Today’s tractors have more electronic controls for more efficient delivery of power to the PTO, drawbar (for pulling), and to the hydraulic system.
The reduction in fuel efficiency seen during years 1991, 1998, and 2004 (figure 1) is attributed to the new emission requirements that went into effect for off-road vehicles. Even though Environmental Protection Agency (EPA) regulations initially challenged engine designers, fuel efficiency has improved significantly since then. All tractors are not equal in fuel consumption. The maximum value line in figure 1 represents the fuel efficiency for the most fuel-efficient tractor for that year. The fuel consumption data is an important consideration during the selection and purchase of a tractor.
Fuel Consumption Estimates
ASABE Standards are widely used for estimating fuel consumption for determining cost of operations. The most widely used relationship for estimating fuel consumption in gallons per hour (gal/h) is
QAVG = a′ ∙ PPTO (1)
where
QAVG = average diesel consumption (gal/h),
PPTO = rated PTO power (hp),
a′ = 0.044 gal/hp-h.
Bowers (2001, e-mail correspondence) stated that equation (1) was developed based on PTO power test results from the Nebraska Tractor Test reports during the mid-1970s. The fuel consumption (gal/h) over the varying PTO power tests (approximately 100 percent, 85 percent, 65 percent, 45 percent, 20 percent, and 0 percent of rated PTO power) were averaged, then the average was divided by the rated PTO power. For this reason, the annual fuel consumption estimates using this method give fuel consumption based on the assumption that the tractor is operated under the same load pattern for equal time. Due to this assumption, this method typically underestimates fuel consumption.
Field Measurement of Fuel Consumption
Farmers may consider numerous ways to estimate and reduce fuel consumption. The first step is to determine how much fuel is being used for a particular field oper- ation and compare it to average usage. This measurement can be completed by filling the fuel tank of the tractor before and after a field operation, noting the number of acres covered. The number of gallons used, divided by the number of acres covered, gives the fuel consumption in gallons per acre (gal/ac). The resulting estimate of fuel consumption can be compared to the values listed in table 21. If measured fuel consumption is higher than the estimated average, the following tips should be considered to reduce fuel consumption:
- Eliminate one or more tillage/field operations.
Substitute one type of tillage operation for another (e.g., chisel for plow).
Combine tillage and other operations into one pass over the field.
Optimize tractor performance (proper amount and distribution of ballast, tire inflation, etc.).
Use “gear-up, throttle-down” (GUTD) practices.
Properly match tractor and implement.
Optimize field efficiency with controlled traffic and navigation aids.
Ensure sufficient machine maintenance.
1 Table 2 reports fuel consumption values for many field operations summarized from various states. Although data is not included from every state and is dated, the values may be useful as guidelines to determine whether fuel usage for a particular operation is reasonable.
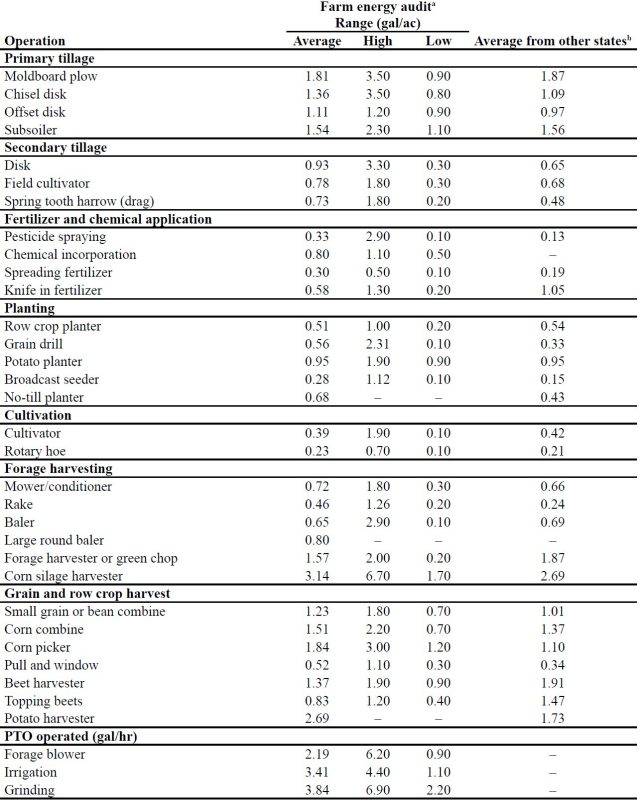
a Helsel, Z., and T. Oguntunde. 1985. Fuel requirements for field operations with energy saving tips. In Farm Energy Use: Standards, Worksheets, Conservation, ed. C. Myers. East Lansing: Michigan State University.
b Iowa, Pennsylvania, Nebraska, Missouri, New York, Oklahoma, North Dakota, and Ontario, Canada
Better Fuel Consumption Estimates
Two equations (“general” and “specific”) have been developed for estimating fuel consumption from Nebraska Tractor Test results. Both are based the relationships between engine load and engine speed (rpm) developed from the tractor test results. Results from more than 500 tractors were used to develop the “general” equations. The “specific” equations used the other method derived from the test results of test conducted on one specific tractor.
Fuel Consumption Estimates for “General” Tractors
Fuel consumption is estimated from reduced engine load and from full-throttle data (along the governor response power curve). ASABE Standards general fuel consumption equations for compression ignition engines were developed as follows:
QF = (0.0434X + 0.019) ∙ PPTO (2)
where
QF = diesel fuel consumption at partial load and full throttle (gal/h),
X = fraction of equivalent PTO power available (decimal).
X = P ⁄ PRATED
where
P = equivalent PTO power required by current operation (hp),
PPTO= rated PTO power available (hp).
QR = QF · [1 − (N − 1) ∙ (0.45X − 0.877)] (3)
where
QR = diesel fuel consumption at partial load and reduced throttle (gal/h),
N = ratio of reduced- and full-throttle engine speeds at operating load (decimal).
N = RPMPT / RPMFT
where
RPMPT = engine speed at partial throttle at reduced engine speed (rpm),/
RPMFT = full-throttle engine speed (rpm).
This “general” equation is useful for predicting fuel consumption by diesel engines under different load and speed conditions.
Fuel Consumption Estimates for “Specific” Tractor Models
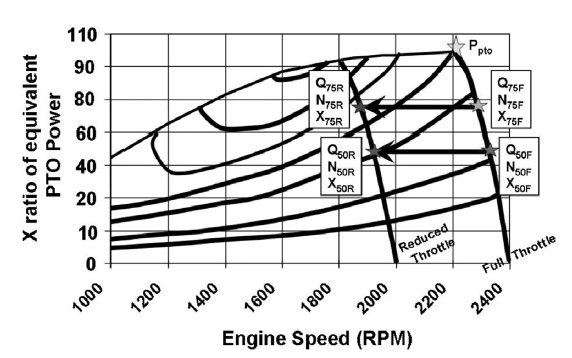
The second equation for estimating fuel consumption was developed from the general model (equations (2) and (3)) and was used to derive the coefficients for specific tractor models. The method uses the NTTL test results, and the defining locations of the fuel consumption parameters are shown in figure 3. The equation for a specific tractor is:
Q = (aX + b) ∙ [1 − (N − 1) ∙ (cX − d)] ∙ PPTO (4)
where
a, b, c, and d coefficients are defined in appendix A,
Q = diesel fuel consumption (gal/h),
X = ratio of equivalent PTO power to rated PTO power (decimal),
N = ratio of reduced- and full-throttle engine speeds at operating load (decimal),
PPTO = rated PTO power (hp).
Coefficients (a, b, c, and d) were computed for specific tractors tested during the period 1986-2008. More than 770 tractors with complete drawbar tests (both 50 percent and 75 percent pull tests) were considered. The use of coefficients specifically calculated to a specific tractor greatly improved the accuracy of prediction. The computation of coefficients for a specific tractor (of your choice) as shown in appendix A.
Fuel Consumption Comparison
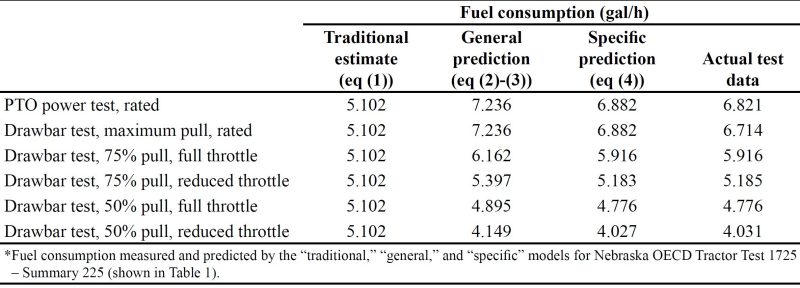
Estimated fuel consumption for the John Deere 7610 (NTTL 1725) is compared against measured fuel consumption during the Nebraska tractor test in table 3. The fuel consumption – estimated using equation (4) – agreed well with measured fuel consumption. On the other hand, estimates using the “general” model were found to be slightly higher. Estimates from the traditional method were consistently lower than the actual fuel consumption for full-load tests. The best estimates were from the “specific” tractor model; the second-best estimates were from the “general” method. Both showed the benefits of GUTD practices.
Table 3. Measured and predicted fuel consumption.*
“Specific” Model Application
The NTTL report can be a very useful resource for computing the coefficients in equation (4). As shown in the example in appendix A, the coefficients can be derived directly from the NTTL reports. To use the “specific” model to predict fuel consumption for a given field operation, ensure that the current engine and the engine reported in the NTTL report are adjusted in the same manner. The high-idle (full-throttle, no-load) engine speed shown in the “Varying Power and Fuel Consumption” section of the NTTL report must be compared with the current engine setting. For example, the high-idle engine speed shown in the NTTL report example (Table 1) is 2,267 rpm. The user’s high-idle engine speed (RPMHI) can be determined by observing the engine speed at full throttle and no load. If the high-idle engine speed is significantly different from the NTTL reported speed, the difference between actual and predicted fuel consumption may be significant.
To determine the engine speed during the field operation (RPM FES), the operator must record the engine speed with the throttle fully open and under typical field load. This engine speed is used to estimate the ratio of rated power being used. The rated engine speed (RPMRATED) is typically found on the tractor’s tachometer, operator’s manual, or NTTL report.
Using the relationship below, the estimated ratio of rated power that is being used during field operation is computed:
X = (RPMHI − RPMFES)/(RPMHI − RPMRATED) (5)
where
RPMHI = high-idle engine speed (rpm),
RPMRATED = rated engine speed for the tractor being considered (rpm),
RPMFES = field engine speed during field operations at full throttle (rpm).
This relationship assumes that the governor response (engine droop on the right side of figure 2) is linear. If this is not the case, use speed ranges found in the “Varying Power and Fuel Consumption” section of the NTTL report to estimate the ratio of rated power.
For example, suppose that a JD7610 model tractor is being used for primary tillage and the field engine speed is 2,150 rpm. From the test report (Table 1) and field testing, the high-idle speed is 2,267 rpm and the rated engine speed is 2,100 rpm. The equivalent power, calculated using equation (5), being used for this operation is 0.7, and using the specific coefficients from the example in appendix A, the fuel-use equation becomes
Q = (0.039X + 0.0203) ∙ [1 − (N − 1) ∙ (0.5247X − 0.9345)] ∙ 115.96 hp
At full throttle (N = 1), the estimated fuel consumption for primary tillage with the JD7610 is
Q = (0.039 ∙ 0.7 + 0.0203) ∙ 115.96 = 5.52 gal/h
To estimate the savings from employing the gear-up and throttle-down practice (GUTD), the operator can look at several engine reduction possibilities and match with the most appropriate. If the tractor engine speed is reduced by 10 percent and 20 percent (N = 0.9 and 0.8, respectively), the decrease of fuel consumption is estimated as:
D10 = 1 − {(0.9 − 1) ∙ [(0.5247 ∙ 0.7) − 0.9345]}
D10 = 0.943, or a 5.7 percent fuel savings for reducing the throttle by 10 percent.
Likewise,
D20 = 0.887, or an 11 percent fuel savings for reducing the throttle by 20 percent.
In terms of fuel consumption rate,
Q10 = 5.52 ∙ 0.943 = 5.21 gal/h, or a savings of 0.31 gal/h,
Q20 = 5.52 ∙ 0.887 = 4.90 gal/h, or a savings of 0.60 gal/h.
The easiest way to reduce the engine speed is from the no-load condition (at high idle). A 10 percent and 20 percent engine-speed reduction would require moving the throttle from high idle (2,267 rpm) to 2,040 rpm and 1,813 rpm, respectively.
Estimating Fuel Consumption From Field Operations
The impact of individual operations of cropping systems for a 350-acre grain/pasture cropping system is examined and compared. The farm is separated into 125 acres for haying operations and 225 acres for traditional corn production using a 100 hp tractor. Table 4 provides the operations that the tractor performs for the grain/pasture operations. Note that the tractor is used for slightly more than 240 hours annually. The estimated fuel consumption using the “traditional” method would be 4.4 gal/h, irrespective of the type of operation; the total fuel use on the 350 acres would be 1,064 gallons.
Table 4. Fuel consumption estimates for field operations using a 100-hp tractor.
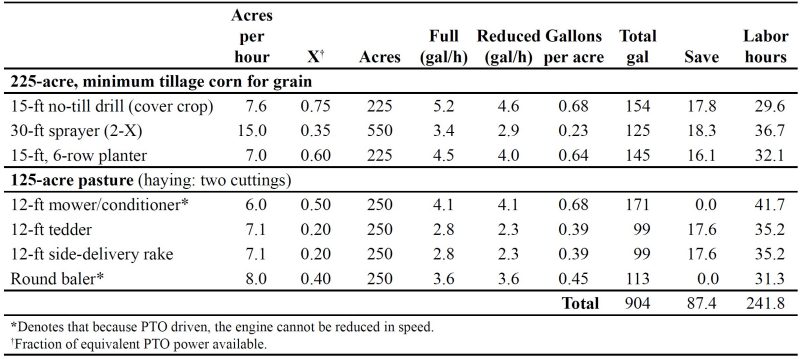
When the “general” model (equations (2) and (3)) is applied for each operation and the load factor is taken into consideration for different field operations that do not require full power, the fuel consumption is estimated at a total of 904 gallons. It is interesting to note that the gallons per acre estimates can be compared with table 2, and the planting operation appears to consume more fuel than other uses (0.64 versus 0.51 gal/ ac). This approach gives producers potential areas to adjust and manage their systems, as well as to optimize their machinery systems based on operating averages.
When the GUTD practice is used in these operations, with only a 20 percent reduction in speed (some operations can probably be dropped further based on the load level), it is estimated that a fuel savings of 87 gallons is possible. This translates into a fuel savings of 10 percent for this tractor annually.
Conclusion
Three methods for estimating tractor fuel consumption are presented. Comparing estimated and measured fuel consumption shows that the fuel consumption estimated using the “specific” model agrees best with the measured fuel consumption. This model has the capability to predict fuel consumption when the tractor is fully or partially loaded and when the engine speeds are reduced from full throttle.
References
ASABE Standards: Agricultural Machinery Management Data. ASABE EP496.3. St. Joseph, Mich.: ASABE.
ASABE Standards: Agricultural Machinery Management Data. ASABE D497.7. St. Joseph, Mich.: ASABE.
Siemens, J. C., and W. W. Bowers. 1999. Machinery Management: How to Select Machinery to Fit the Real Needs of Farm Managers. Farm Business Management Series. Davenport, Iowa: John Deere Publishing.
Original Sources of Fuel Predictions
Grisso, R. D., M. F. Kocher, and D. H. Vaughan. 2004. Predicting tractor fuel consumption. Applied Engineering in Agriculture 20(5): 553-61.
Grisso, R. D., D. Vaughan, and G. Roberson. 2008. Fuel prediction for specific tractor models. Applied Engineering in Agriculture 24(4): 423-28.
Additional Reading Materials
Five Strategies for Extending Machinery Life. VCE publication 442-451.
Gear Up and Throttle Down: Saving Fuel. VCE publication 442-450.
Using Tractor Test Data for Selecting Farm Tractors. VCE publication 442-072.
For tractor test information, contact:
University of Nebraska Tractor Test Laboratory
P. O. Box 830832
134 Splinter Labs UNL, East Campus
Lincoln, NE 68583-0832
(402) 472-2442
Fax: (402) 472-8367
http://tractortestlab.unl.edu/
E-mail: tractortestlab@unl.edu
Acknowledgments
The authors acknowledge the contributions made by David Vaughan, John Perumpral, Gary Roberson, and Robert Pitman.
Appendix A. Determination of Coefficients in equation (4) for a “specific” tractor.
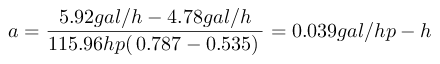
a = (Q75F − Q50F )/[PPTO (X75F − X50F)] (6)
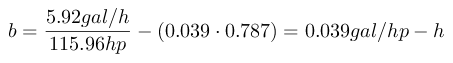
b = (Q75F/PPTO) − aX75 (7)
c = (f/h − e/g)/(X75F − X50F) (8)
d = cX50F + f/h (9)
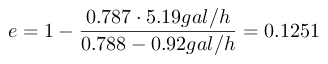
e = 1 − [(X75F ∙ Q75R)/(X75R ∙ Q75F)] (10)
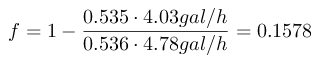
f = 1 − [(X50F ∙ Q50R)/(X50R ∙ Q50F)] (11)
g = (RPM75F − RPM75R)/RPM75F (12)
h = (RPM50F − RPM50R )/RPM50F (13)
where
Q = diesel fuel consumption (gal/h),
X = ratio of equivalent PTO power to rated PTO power (decimal),
N = ratio of reduced- and full-throttle engine speeds at operating load (decimal),
RPM = engine speed for partial loads from full and reduced throttle (rpm),
PPTO = rated PTO power (hp).
The specific subscript refers to the condition maintained during the test. The tractor tests were conducted at full throttle (F) and reduced throttle (R) during the 50 percent and 75 percent drawbar load tests. For example, Q75F is the fuel consumption at 75 percent drawbar load and full throttle. The calculations are based on fuel consumption data, power levels, and engine speed from four partial-load drawbar load tests and the PTO and drawbar power at rated engine speed. The equivalent power ratios (at the four test points) were computed from maximum drawbar power at rated engine speed and the current power level.
Below are the coefficients determined using equations (6) through (13) for the tractor test Summary 225 (Table 1):
PPTO = 115.96 hp
PMaxDB = 96.26 hp
RPM50F = 2,221 rpm
Q50F = 51.48 hp/(10.78 hp-h/gal) = 4.78 gal/h
X50F = 51.48 hp/96.26 hp = 0.535
RPM75F = 2,190 rpm
Q75F = 75.72 hp/(12.8 hp-h/gal) = 5.92 gal/h
X75F = 75.72 hp/96.26 hp = 0.787
RPM50R = 1,685 rpm
Q50R = 51.60 hp/(12.80 hp-h/gal) = 4.03 gal/h
X50R = 51.60 hp/96.26 hp = 0.536
RPM75R = 1,665 rpm
Q75R = 75.86 hp/(14.63 hp-h/gal) = 5.19 gal/h
X75R = 75.86 hp/96.26 hp = 0.788
g = (2,190 − 1,665 rpm)/2,190 rpm = 0.2397
h = (2,221 − 1,685 rpm)/2,221 rpm = 0.2413
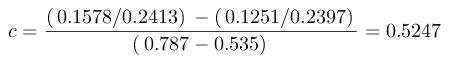
d = (0.5247 ∙ 0.5350) + (0.1578/0.2413) = 0.9345
Substituting the coefficients a, b, c, and d in equation (4), the final prediction equation for JD7610 becomes:
Q = (0.0390X + 0.0203) ∙ [1 − (N − 1) ∙ (0.5247X − 0.9345)] ∙ 115.96 hp
This equation can be used to predict the fuel consumption when a JD7610 is used for different field operations with varying loads and engine speeds. An Excel spreadsheet (figure A-1) may also be used for computing coefficients using data from the Nebraska Tractor Test Laboratory report.
Virginia Cooperative Extension materials are available for public use, reprint, or citation without further permission, provided the use includes credit to the author and to Virginia Cooperative Extension, Virginia Tech, and Virginia State University.
Virginia Cooperative Extension is a partnership of Virginia Tech, Virginia State University, the U.S. Department of Agriculture, and local governments. Its programs and employment are open to all, regardless of age, color, disability, sex (including pregnancy), gender, gender identity, gender expression, national origin, political affiliation, race, religion, sexual orientation, genetic information, military status, or any other basis protected by law
Publication Date
May 13, 2020